Download
1 / 16
160 likes | 281 Views
This comprehensive overview explores the fundamentals of inflation and its measurement through the Consumer Price Index (CPI) and alternative indices. It delves into the differences between CPI-U and C-CPI-U, discusses common misconceptions about the CPI, and critiques the current methods employed by the Bureau of Labor Statistics (BLS). It outlines the fixed and variable weight indices, the components of the CPI, and how inflation impacts real income. This resource is essential for students and anyone interested in economic principles related to inflation.

E N D
Inflation Basics Dr. D. Foster – ECO 285 – Spring 2014
Required Readings - CPI • Critiquing the CPI (St. Louis Fed) • Overview of BLS Statistics on Inflation and Prices (BLS) • Common misconceptions about the CPI – Q&A (BLS) • Response to BLS (Shadow Gov’t Statistics) • Alternative Inflation Measures (Shadow Gov’t Statistics) • Differences between CPI-U and C-CPI-U (CBO) • Chained, Chained, Chained (The Economist) • Taking the Price Temperature (Mises.org) • Peter Schiff on “inflation propaganda” (YouTube)
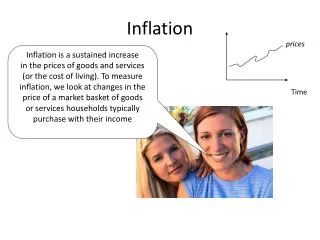
Inflation Defined A continuous rise in the general price level. • Not a rise in some prices. • Not a one-time rise in prices. • What is the “general price level”? • Price level is shown by a Price Index • Hold quantities constant over time • Use old quantities • Use new quantities • Allow some quantity change Laspeyres; CPI Paasche Chained CPI & GDP deflator
Laspeyres & Paasche price indexes ∑(P1*Q0) ∑(P0*Q0) $456.00 $441.25 • Laspeyres: • Paasche: = = 103.34 ∑(P1*Q1) ∑(P0*Q1) $447.00 $440.50 = 101.48 = The CPI uses a Laspeyres index like this, showing inflation of 3.34%.
The Consumer Price Index(es) • CPI-U: All urban consumers • A fixed-weight index: consumption patterns rigid. • Market basket is updated every two years. • Represents about 87% of U.S. population. • Used to adjust income tax brackets to account for inflation. • Monthly, 60,000 prices are collected. • Goods & services comprise 200 groups. • Eight broad categories:
The Consumer Price Index(es) • CPI-U: All urban consumers • A fixed-weight index: consumption patterns rigid. • Market basket is updated every two years. • Represents about 87% of U.S. population. • Used to adjust income tax brackets to account for inflation. • Monthly, 60,000 prices are collected. • Goods & services comprise 200 groups. • Eight broad categories: • FOOD AND BEVERAGES (breakfast cereal, milk, coffee, chicken, wine, full service meals, snacks) • HOUSING (rent of primary residence, owners' equivalent rent, fuel oil, bedroom furniture) • APPAREL (men's shirts and sweaters, women's dresses, jewelry) • TRANSPORTATION (new vehicles, airline fares, gasoline, motor vehicle insurance) • MEDICAL CARE (prescription drugs and medical supplies, physicians' services, eyeglasses and eye care, hospital services) • RECREATION (televisions, toys, pets and pet products, sports equipment, admissions); • EDUCATION AND COMMUNICATION (college tuition, postage, telephone services, computer software and accessories); • OTHER GOODS AND SERVICES (tobacco and smoking products, haircuts and other personal services, funeral expenses).
The Consumer Price Index(es) • CPI-W: Urban wage earners & clerical workers • A fixed-weight index. • Represents about 32% of U.S. population. • Half of HH income from clerical, craft, service. • Excludes salaried, part-time, self-employed … • Records average spending on 80,000 items in 87 geographical areas around the country. • Used to adjust Social Security payments to keep up with cost of living (COLAs).
The Consumer Price Index(es) • C-CPI-U: Chained CPI, all consumers • A variable-weight index. • Designed to account for “substitution bias.” • When the price of pork rises, people buy more fish. • CPI-U only accounts for narrow substitution, e.g., if the price of Granny Smith apples rise relative to Red Delicious. • Designed to be a better measure of the cost of living. • Records consumer expenditures each month and allows for changing composition of the basket.
Using Price Indexes • Converts nominal values into real values: • Example: Your income in 2013 is $32,000 and in 2014 it is $33,100.Q - Are you “better off?” • Convert to “real income” by looking at CPI: Say it was 172.2 in 2013 and 179.9 in 2014
Features of Price Indexes CPI2003 = 184 CPI2013 = 233 Inflation = (233-184)/184 = 26.6% Approx. annual inflation = 2.66% (10 years) Actual ave. annual inflation = (233/184)^(1/10)-1 = 2.39%
Calculating the C-CPI-U L: 103.34 P: 101.48
For further information (recommended) • Wiki on Price Index • Wiki on Consumer Price Index • Wiki on Chained Consumer Price Index • The Chained CPI: What Is It … • Wiki on Producer Price Index • BLS on Producer Price Index FAQs • Wiki on GDP Deflator
Inflation Basics Dr. D. Foster – ECO 285 – Spring 2014