Download
1 / 57
570 likes | 668 Views
Life-Cycle of Tropical Storm Erin (2007). Thomas J. Galarneau, Jr., and Lance F. Bosart University at Albany, State University of New York Albany, NY *with contributions from Roger Edwards, SPC 9th Annual Northeast Regional Operational Workshop 8 November 2007. Motivation.

E N D
Life-Cycle ofTropical Storm Erin (2007) Thomas J. Galarneau, Jr., and Lance F. Bosart University at Albany, State University of New York Albany, NY *with contributions from Roger Edwards, SPC 9th Annual Northeast Regional Operational Workshop 8 November 2007
Motivation • Widespread post-landfall rainfall and wind associated with Tropical Storm (TS) Erin during 16–23 August 2007
Goals • Overview large-scale environment • Examine aspects of TS Erin life-cycle in more detail: • Incipient development to landfall along TX coast • Widespread TX rains/reintensification over OK • “PRE” over WI • KY rains and VA/NC MCS
Goals • Overview large-scale environment • Examine aspects of TS Erin life-cycle in more detail: • Incipient development to landfall along TX coast • Widespread TX rains/reintensification over OK • “PRE” over WI • KY rains and VA/NC MCS
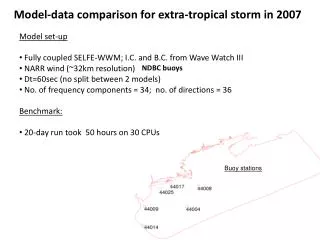
Data Sources • 2.5 NCEP–NCAR Reanalysis from ESRL • 1.0 NCEP–GFS final analysis from NCAR • Soundings from University of Wyoming • Standard surface data from UAlbany • OK Mesonet data from OK Climo Survey • Radar imagery from NCAR and SPC • Precipitation analyses from NPVU • Trajectories from NOAA HYSPLIT model
250 hPa (dam) mean and anomaly and vector wind (standard barbs) mean 9–23 August 2007 21 19 23 17 Erin track 15 13 2.5 NCEP–NCAR Reanalysis
250 hPa (dam) mean and anomaly and vector wind (standard barbs) mean 9–23 August 2007 PRE 00–12Z/19 intense rains 06Z/21–18Z/21 reintensification 00–06Z/19 21 19 23 MCS 21Z/21–06Z/22 intense rains 12Z/16–18Z/18 17 landfall 06Z/16 15 13 2.5 NCEP–NCAR Reanalysis
reintensification over Oklahoma, and Wisconsin PRE North Carolina/Virginia MCS Kentucky rains landfall DT (K) 850–DT shear (m s1) and CI (K) Time/Date (UTC) 1.0 GFS Final Analyses Azimuth average of DT (K), 850 hPa–DT wind shear (m s1), and CI (K)
Incipient development–landfall0000 UTC 8–1200 UTC 16 Aug 2007
DT (K), 850–DT shear (knots), and 925–850 hPa (10-4 s-1) x L=“Erin” X=DT disturbance =DT trough 1200 UTC 7 August 2007 1.0 NCEP–GFS Analyses
DT (K), 850–DT shear (knots), and 925–850 hPa (10-4 s-1) x L L=“Erin” X=DT disturbance =DT trough 1200 UTC 8 August 2007 1.0 NCEP–GFS Analyses
DT (K), 850–DT shear (knots), and 925–850 hPa (10-4 s-1) x x L L=“Erin” X=DT disturbance =DT trough 1200 UTC 9 August 2007 1.0 NCEP–GFS Analyses
DT (K), 850–DT shear (knots), and 925–850 hPa (10-4 s-1) x x x L L=“Erin” X=DT disturbance =DT trough 1200 UTC 10 August 2007 1.0 NCEP–GFS Analyses
DT (K), 850–DT shear (knots), and 925–850 hPa (10-4 s-1) x x L L=“Erin” X=DT disturbance =DT trough 1200 UTC 11 August 2007 1.0 NCEP–GFS Analyses
DT (K), 850–DT shear (knots), and 925–850 hPa (10-4 s-1) x x L L=“Erin” X=DT disturbance =DT trough 1200 UTC 12 August 2007 1.0 NCEP–GFS Analyses
DT (K), 850–DT shear (knots), and 925–850 hPa (10-4 s-1) x x L L=“Erin” X=DT disturbance =DT trough 1200 UTC 13 August 2007 1.0 NCEP–GFS Analyses
DT (K), 850–DT shear (knots), and 925–850 hPa (10-4 s-1) x L L=“Erin” X=DT disturbance =DT trough 1200 UTC 14 August 2007 1.0 NCEP–GFS Analyses
DT (K), 850–DT shear (knots), and 925–850 hPa (10-4 s-1) x x L x L=“Erin” X=DT disturbance =DT trough 1200 UTC 15 August 2007 1.0 NCEP–GFS Analyses
DT (K), 850–DT shear (knots), and 925–850 hPa (10-4 s-1) x x L x L=“Erin” X=DT disturbance =DT trough 1200 UTC 16 August 2007 1.0 NCEP–GFS Analyses
TX rains andOK reintensification0000 UTC 17–0000 UTC 20 Aug 2007
DT (K) and vector wind (knots), and 925–850 hPa (10-4 s-1) Source: NPVU Erin 1200 UTC 17 August 2007 1.0 NCEP–GFS Analyses
DT (K) and vector wind (knots), and 925–850 hPa (10-4 s-1) Source: NPVU Erin 1200 UTC 18 August 2007 1.0 NCEP–GFS Analyses
DT (K) and vector wind (knots), and 925–850 hPa (10-4 s-1) Source: NPVU Erin 1200 UTC 19 August 2007 1.0 NCEP–GFS Analyses
12Z/16 Source: NCAR image archive
18Z/16 Source: NCAR image archive
00Z/17 Source: NCAR image archive
1000 J kg-1 FWD 200 J kg-1 DRT 00Z/17 Source: NCAR image archive
06Z/17 Source: NCAR image archive
12Z/17 Source: NCAR image archive
18Z/17 Source: NCAR image archive
00Z/18 Source: NCAR image archive
00Z/18 FWD MAF 00Z/18 1800 J kg-1 130 J kg-1 Source: NCAR image archive
06Z/18 Source: NCAR image archive
12Z/18 Source: NCAR image archive
18Z/18 Source: NCAR image archive
00Z/19 Source: NCAR image archive
OUN FWD 1800 J kg-1 00Z/19 1300 J kg-1 Source: NCAR image archive
06Z/19 Source: NCAR image archive
12Z/19 Source: NCAR image archive
Surface and 12Z/19 baroclinic zone Erin L
X (105 s1), (K), and vector wind (knots)
0400–1300 UTC 19 August 2007 BREF and OK Mesonet Observations Source: Roger Edwards, NOAA/NWS/SPC
L L 0500–1300Z/19 Source: Roger Edwards, NOAA/NWS/SPC
06Z/19 PRE Erin Source: NCAR image archive
Surface and 06Z/19 PRE baroclinic zone Erin L
24 h Total Precipitation (in.) ending 12Z/19 PRE Erin Source: NPVU
24 h Total Precipitation (in.) ending 12Z/19 PRE Erin OAX 12Z/19 SGF 00Z/19 Source: NPVU
700 (dam), 1000–500 , 850–500 wind (knots), and Precipitable Water (mm) L 1200 UTC 16 August 2007 1.0 NCEP–GFS Analyses