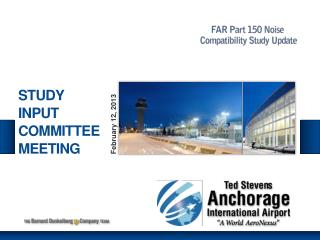
STUDY INPUT COMMITTEE MEETING
350 likes | 467 Views
The February 12, 2013 meeting agenda for the Aircraft Noise Study Input Committee outlines key discussion points including the introduction of background noise data, summaries of aircraft noise forecasts, and the draft of existing and future noise contours. The study evaluates two main components: aircraft noise and land use. Additionally, it incorporates essential metrics such as Maximum Noise Level (Lmax), Sound Exposure Level (SEL), and Day-Night Average Level (DNL). Public input is sought for the development of alternatives and recommendations moving forward.

STUDY INPUT COMMITTEE MEETING
E N D
Presentation Transcript
STUDY INPUTCOMMITTEE MEETING February 12, 2013
Agenda. • Introduction • Background on Noise (Chapter C) • Summary of AIAS Forecasts (Chapter B) • Supplemental Metrics Summary (Chapter D) • Draft Existing and Future Noise Contours (Chapter D) • Land Use/Population Analysis (Chapter E) • Questions/Comments
Purpose of Study. • The Study identifies and evaluates two components: Aircraft noise and land use, both existing and future. • The Study consists of two distinct, but complementary elements: Noise Exposure Maps and a Noise Compatibility Program. • The Noise Exposure Maps (NEMs) are accepted by the Federal Aviation Administration. • Noise Compatibility Program is approved by FAA.
Noise Metrics. • Single Event Metrics • Maximum Noise Level (Lmax) • Sound Exposure Level (SEL) • Cumulative Noise Metrics • LEQ Noise Level • LEQ is generally a 1 hour equivalent, but may be other such as 15 minute or 24 hour • Cumulative Daily Noise Metrics • DNL Noise Level • Built from SEL and LEQ noise
Single Event Metrics • Lmax • Highest noise event level reached during a noise event • Aircraft noise rises above ambient noise, then decreases until sound levels settle to ambient levels • SEL • Good method to describe single noise events • SEL combines Lmax and duration and is calculated when the sound is within 10 dB of the maximum, and then normalized to a sound level that would have the same energy but with a duration of 1 second.
Single Event Metrics • Flow DNL • The 24 hour weighted average noise level on a day when flow is in one specific direction. It is a one day DNL, i.e., the DNL on a day with that flow direction. • Time Above • Minutes per day that noise level exceeds stated noise level (annual average). • Number Above • The number of times per day that the maximum noise level of a flyover exceeds a stated noise level, usually 70 dBA (annual average).
Cumulative Metrics • LEQ • Equivalent Noise Level • “Energy” average taken from the sum of all sound that occurs during a certain period of time (generally one hour) • Day Night Noise Level (DNL) • Average noise experienced in a 24 hour day • Nighttime operations (10 p.m. to 7 a.m.) weighted by 10 dB • Metric used by FAA to identify land use compatibility
SEL 747/ 737 East Comparison Note: Percentages are the percent of time that aircraft are in that direction flow. Figure represent takeoff SEL and approach SEL and are shown together here for simplicity; technically 2 events are shown.
SEL 747/737 West Comparison Note: Percentages are the percent of time that aircraft are in that direction flow. Figure represent takeoff SEL and approach SEL and are shown together here for simplicity; technically 2 events are shown.
SEL 747/737 South Comparison Note: Percentages are the percent of time that aircraft are in that direction flow. Figure represent takeoff SEL and approach SEL and are shown together here for simplicity; technically 2 events are shown.
SEL Beaver East Note: Percentages are the percent of time that aircraft are in that direction flow. Figure represent takeoff SEL and approach SEL and are shown together here for simplicity; technically 2 events are shown.
Supplemental Metrics Summary • The existing preferential use program is most effective noise control program used currently at ANC • When winds, airfield maintenance, or traffic require that non-preferential runway flow is used, noise levels in the community are increased significantly compared to normal use • Summer Lake Hood operations increase number of flyover events and noise levels compared to winter operations and annual averages
Next Steps • Alternatives Development • Alternatives Analysis • Public Input on Alternatives • Development of Recommendations
Comments and Additional Information. • Mr. Ryk Dunkelberg • Barnard Dunkelberg & Company • Cherry Street Building • 1616 East 15th Street • Tulsa, OK 74120 • Phone Number. 918-585-8844 • FAX Number. 918-585-8857