Download
1 / 15
160 likes | 457 Views
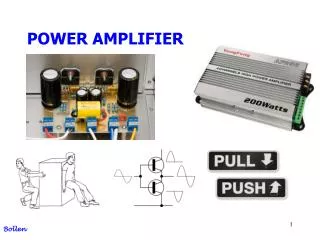
Power Amplifier Nonlinearity Estimation and Predistortion with Correlation Techniques Mingyuan Li, Ian Galton, Larry Larson, Peter Asbeck University of California, San Diego La Jolla, CA 92093-0407. Outline. Nonlinearity extraction in frequency and time domain

E N D
Power Amplifier Nonlinearity Estimation and Predistortion with Correlation Techniques Mingyuan Li, Ian Galton, Larry Larson, Peter Asbeck University of California, San Diego La Jolla, CA 92093-0407
Outline • Nonlinearity extraction in frequency and time domain • Correlation techniques for nonlinearity estimation • Mathematical analysis and simulation results • Application in adaptive predistortion and measured results • Summary and conclusion
AM-AM and AM-PM nonlinearity Single tone and two-tone power sweep measurement Behavioral model Measurement of Intersil’s ISL3990 Dual Band PA Gain and phase vs input power Look Up Table behavioral model Gain and phase values vs envelope amplitude r(t) Complex polynomial curve fitting model Intermodulations vs input power Pro: Simple to characterize and analyze nonlinearity Con: 1. Not actual signal 2. Can’t test during normal operation conditions
Time-domain CDMA envelope test (a) (b) Assess nonlinearity in adaptive predistortion Vout (red) vs. vin(blue) (a) real part (b) imaginary part Gain vs. Pin using time-domain captured data Phase vs. Pin using time-domain captured data Pro: Actual signal, test during PA operation Con: 1. High resolution and speed ADC 2. Large memory 3. Considerable DSP
+ 1 Vout=Linear(Vin)+Nonlinear(Vin) - 1 S 1 Vin DS-CDMA + X PA S 2 S 3 LO S test X Correlation S = S * S * S test 1 2 3 PA nonlinearity Correlation techniques for nonlinearity estimation • Basic idea Nonlinearity comes from output with 3rd,5th… order dependency on input. Create test signal which also has 3rd,5th… order dependency on input. Extract nonlinearity by proper correlation of output and test signal Stest is uncorrelated with linear(Vin) Stest is correlated with nonliear(Vin) Advantages • Actual signal in real operation conditions • Low hardware and power consumption
Correlation non Stest terms average to zero dominant Stest terms Correlation mathematical analysis • Assumptions • Quasi-memoryless • Polynomial model truncated at the 5th order
Complex power series analysis Imag correlation value Real correlation value Power correlation value Polynomial coefficients extraction by correlation
Comparison of correlation with other techniques Construct AM_AM and AM_PM using polynomial coefficients derived by correlations Different order with different slopes Comparison of two-tone and correlation
Correlation experimental measurements Intersil’s ISL3990 PA 5 Channel PN with 48-tap FIR and Length is 217 Sampling rate is 4*1.2288MHz (a)First order II (b)Third order IQ (d)Power correlation vs. Pin (c) Fifth order II
Adaptive predistortion application Predistortion architecture Using the correlation extracted values P3corr and P5corr as an object function to adaptively change predistorter’s coefficients
Adaptive search algorithm(Hooke &Jeeves) Contour of correlation values vs. predistortion coefficients
Measurement results (1) ISL3990 PA P1db= -10dBm Psat=10dBm Pmax=24.5dBm 3rd correlation values(dB) vs. b3 Acpr@750kHz(dBc) vs. b3 Acpr@750kHz(dBc) vs. b5 3rd correlation values(dB) vs. b5 Amplifier before predistortion is at (b3r,b3i,b5r,b5i=0) point@Pin=-10dBm
Measurement results (2) Magenta before PD, Green after PD @Pin=-10dBm before PD Magenta curve has larger correlation values and worse ACPR Green curve has smaller correlation values and better ACPR ACPR difference of 14.3dB@750kHz 4.8dB@1980kHz after PD
Summary and conclusion • Simple correlation techniques have been used to estimate nonlinearity • Simulation and measurement results show promise of technique • Application in forward link adaptive predistortion transmitter was shown experimentally • Optimization algorithm was developed to adaptively change coefficients • For future, expect that simple analog correlation circuit can be implemented and memory effects can be considered