Download

1 / 40
420 likes | 736 Views
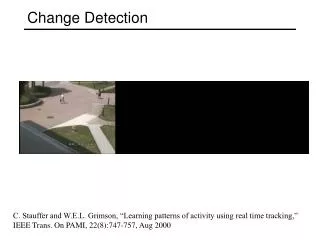
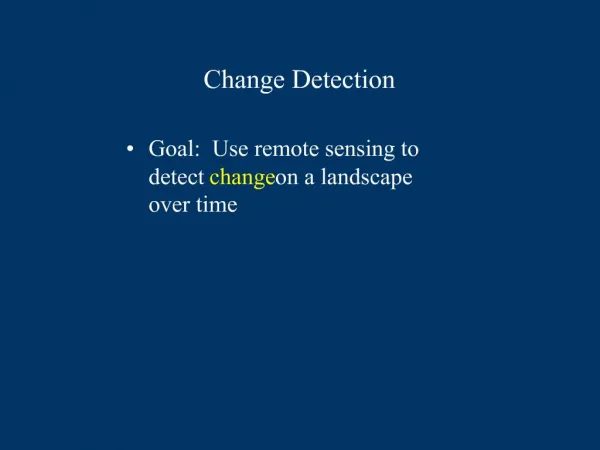
Applying Change Point Detection in Vaccine Manufacturing. Hesham Fahmy, Ph.D. Merck & Co., Inc. West Point, PA 19486 hesham_fahmy@merck.com. Midwest Biopharmaceutical Statistics Workshop (MBSW) - MAY 23 - 25, 2011. Outline. Definitions Detection methods CUSUM and EWMA estimators

E N D
Applying Change Point Detection in Vaccine Manufacturing Hesham Fahmy, Ph.D. Merck & Co., Inc. West Point, PA 19486 hesham_fahmy@merck.com Midwest Biopharmaceutical Statistics Workshop (MBSW) - MAY 23 - 25, 2011
Outline • Definitions • Detection methods • CUSUM and EWMA estimators • Case studies • CUSUM and EWMA • SSE • Conclusions
Methods of Detection • Visual (Simple but Subjective) • Raw data; run chart • CUSUM chart • EWMA chart • Analytical (Complicated but Objective) • Change-Point estimators; i.e. CUSUM, EWMA • Mathematical Modeling; i.e. MLE, SSE
Types of Variation • Common Causes– natural (random) variations that are part of a stable process • Machine vibration • Temperature, humidity, electrical current fluctuations • Slight variation in raw materials • Special Causes – unnatural (non-random) variations that are not part of a stable process • Batch of defective raw material • Faulty set-up • Human error • Incorrect recipe
Cumulative Sum Control Chart • CUSUM: cumulative sum of deviations from average • A bit more difficult to set up • More difficult to understand • Very effective when subgroup size n=1 • Very good for detecting small shifts • Change-point detection capability • Less sensitive to autocorrelation
Exponentially Weighted Moving Average • EWMA: weighted average of all observations • A bit more difficult to set up • Very good for detecting small shifts • Change point detection capability • Less sensitive to autocorrelation “EWMA gives more weight to more recent observations and less weight to old observations.” 0 1 Shewhart CUSUM
Process Shifts Step Linear Nonlinear Others
t Process Model Change point, "Unknown" in-control state out-of-control state
EWMA Change-Point Estimation Procedure (Nishina 1992) Change-Point Estimation Procedures • CUSUM Change-Point Estimation Procedure (Page 1954)
Example: Actual Change-Point= 20 Most Recent Reintialization at t =22
Most Recent time at t =19 Example: Actual Change-Point= 20 UCL=11 LCL=9
Simulated Case Studies • To test different methods' (control charts/analytical) capability for identifying change-points • Case # 1: small shifts/drifts • Case # 2: mirror image of case # 1 • Case # 3: large shifts/drifts
Case # 1 1 & 6: In-control process; N(0,1) 2 : -ve linear trend; 0.1 sigma 3 : Step shift; N(-3,1) 4 : Step shift; N(-1.5,1) 5 : +ve linear trend; 0.1 sigma
CUSUM (V-Mask) Diagnostic Sequence Plot Detection Criterion: Slope Change
CUSUM; Exact Profile
EWMA; Detection Criterion: Slope Change
EWMA; Same Profile CUSUM
Case # 2 “Mirror Image” 1 & 6: In-control process; N(0,1) 2 : +ve linear trend; 0.1 sigma 3 : Step shift; N(3,1) 4 : Step shift; N(1.5,1) 5 : -ve linear trend; 0.1 sigma
CUSUM Chart Case # 2 Mirror Image Case # 1
Case # 3 1 & 6: In-control process; N(0,1) 2 : +ve linear trend; 0.5 sigma 3 : Step shift; N(12.5,1) 4 : Step shift; N(9.5,1) 5 : -ve linear trend; 0.38 sigma
Detection by SSE • Pick a window of about 30 points including the “investigated point” • Fit a two-phase regression using all possible change-points & calculate the SSE • Plot possible change-points vs. their SSEs
Conclusions • Change-point problem is general and can be applied in many applications such as 4 parameter logistic regression and degradation curves. • Another application in manufacturing processes includes detection of the change-point for process variance. • It is preferred to combine both analytical and visual techniques; in addition to process expertise; to get accurate results.
References • Fahmy, H.M. and Elsayed, E.A., Drift Time Detection and Adjustment Procedures for Processes Subject to Linear Trend. Int. J. Prod. Research, 2006, 3257–3278. • Montgomery, D. C., Int. to Stat. Quality Control, 1997, (John Wiley: NY). • Nishina, K., A comparison of control charts from the viewpoint of change-point estimation. Qual. Reliabil. Eng. Int., 1992, 8, 537–541. • Pignatiello, J.J. Jr. and Samuel, T.R., Estimation of the change point of a normal process mean in SPC applications. J. Qual. Tech., 2001, 33, 82–95. • Samuel, T.R., Pignatiello Jr., J.J. and Calvin, J.A., Identifying the time of a step change with X control charts. Qual. Eng., 1998, 10, 521–527.
Acknowledgements • Lori Pfahler • Julia O’Neill • Jim Lucas