Download

1 / 20
210 likes | 392 Views
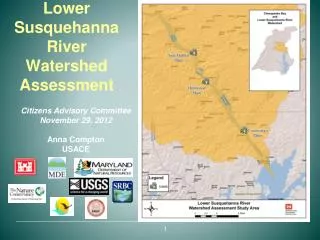
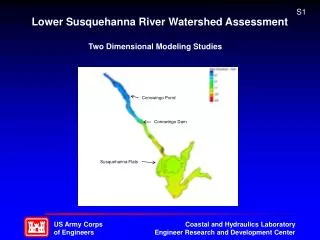
Lower Olentangy Watershed. Sarah Kelley Dominique Pope Kiah Lotus. The Lower Olentangy Watershed. The lower Olentangy watershed includes 4 counties, Union, Madison, Franklin, and Delaware.

E N D
Lower Olentangy Watershed Sarah Kelley Dominique Pope Kiah Lotus
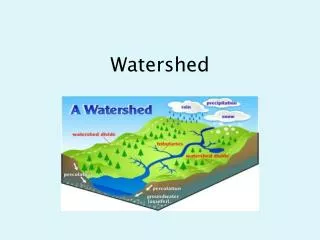
The Lower Olentangy Watershed • The lower Olentangy watershed includes 4 counties, Union, Madison, Franklin, and Delaware. • The majority of the watershed is in Franklin county, but also encompasses areas of Madison, Delaware and Union counties. Most of Columbus is located within this watershed. • The major sources of impairment are nutrient enrichment and habitat/flow alterations.
Land Use of the Lower Olentangy • The majority of this watershed is an urban area. • There are twelve sampling stations along the Olentangy River. • Six of the stations are in city areas, six are in non-city areas.
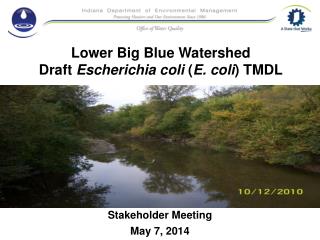
HYPOTHESIS 1 • We think that when a farmer puts fertilizer on his/her crops, the rain washes it down into the stream causing the biological oxygen demand (BOD) to rise in rural areas. • Fertilizers (nutrients) increase vegetation, which decay and attract bacteria. Bacteria consume oxygen, increasing the BOD. High BOD is unfavorable for life.
RESULTS • We found out that our hypothesis was supported, because the data shows higher BOD in rural areas where there is more farming and fertilizer runoff.
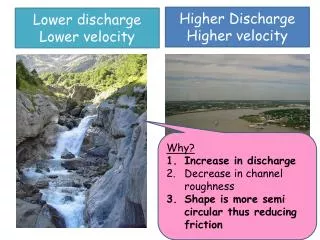
HYPOTHESIS 2 • We think that there will be more sediments (total suspended solids or TSS) in city waterways then in agricultural waterways due to river straightening and habitat destruction.
RESULTS • This hypothesis was disproved, because there turned out to be more sediment in the non-city areas. • We believe this has happened because farmers are plowing to the edge of their land. This is causing the erosion of the banks.
HYPOTHESIS 3 • We believe that the lower the quality of the habitat (measured by QHEI, the quantitative habitat index), the lower the ICI count. • ICI is a measure of the amount of invertebrates in the water. • A healthier system has a higher ICI count.
RESULTS • The hypothesis was supported by this data. When the QHEI went up, the ICI count went up. Therefore, the better the habitat, the healthier the community.
DEVIATIONS • We separated the sampling stations into city and rural. Each category was mostly consistent except for two stations that showed large deviations, stations 159 and 86.
ICI and Maximum pH Values in City and Farm Sampling Stations
HYPOTHESES • Station 86 shows very high levels of nutrients and high BOD levels, perhaps due to high concentrations of farming in the area. • The EPA reports that the area of the watershed where station 159 is located is polluted with a lot of wastewater runoff.
CONCLUSION • We chose to study the Lower Olentangy Watershed, which had some healthy and impaired areas. • Based on class/group discussions and our field trip experience, we formed three hypothesis. • Runoff of fertilizer from crops impairs water quality. • River modification in urban areas increases sediment. • Better quality habitats lead to healthier ecosystems.
CONCLUSION • We looked at the water shed maps and graphed data values to test our hypotheses. • We found biological oxygen demand was greater in rural areas which supported hypothesis 1. • We found total sentiment suspension was greater in urban areas which made hypothesis 2 wrong. • We found that ICI does increase with better quality habitats.
We would like to Thank • Chaperones • Lori Summers, Paula Williams, Fen Lewis, Virginie Bouchard, Sharon Schraegle, Shannon Schraegle, Kelly Dufore • Naturalists • Carrie, Elisse, Tim, and Greg • Organizers • Sue Brown and Elaine Landwehr • Instructors/Panelists/Speakers • Steve Gordon, Virginie Bouchard, Lori Summers, Kathryn Kelley, Bettina Bair, Debra Haley, Sushma Joshi, Charlotte Elster, Gabrielle Gordon, Maria Palazzi, Barbara Woodall, Leslie Southern, and Kay Howell • Videographers • Kevin and Jason • YWSI 2000 Friends