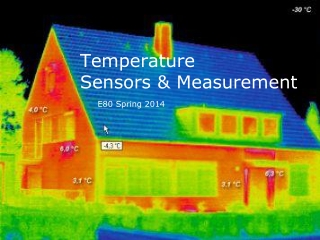

Temperature Measurement
E N D
Presentation Transcript
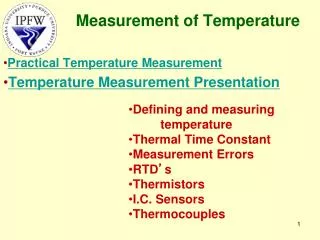
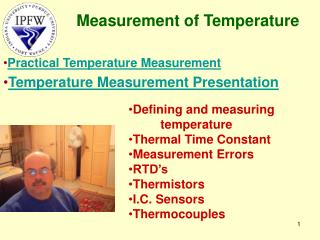
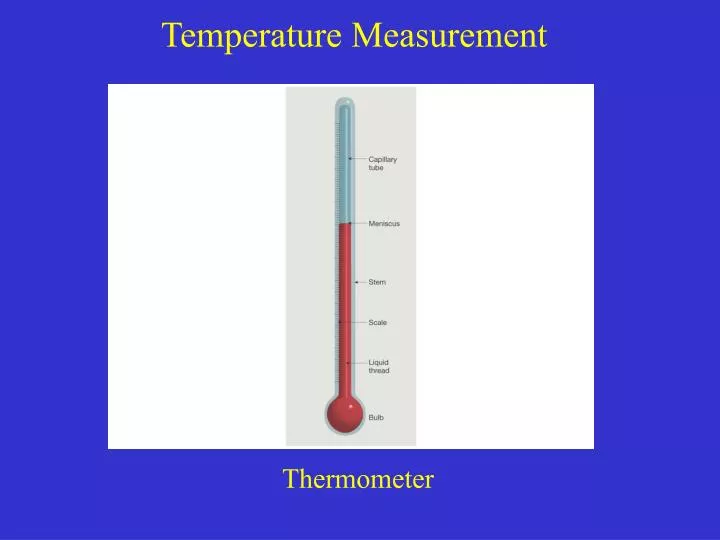
Temperature Measurement Thermometer
Air Temperature Data Daily Mean Daily Range Monthly Mean Annual Mean Annual Range Normal
Temp. time series: temp at one place over time Salt Lake City Temperatures 2004 – Observed, Normals, Records
What Controls Temperatures at a Particular Location? • Latitude • Altitude • Nearby water (especially oceans) • Ocean currents • Position relative to prevaling winds • Mountains isolate water effects • Cloud cover (and albedo)
Altitude Guayaquil: sealevel Quito: 9200 ft
Hidden Peak, Snowbird Alt = 11,000’ High = 32oF North Provo Alt = 4600’ High = 47oF
Oceans (water) Moderate Temps of Coastal Areas Sacramento San Francisco Monthly average high & low temps for Sacramento (red) and San Francisco (black) California
Geographic Position Mountains
Alta Base 8800’47oF Highs Effects ofInversion & Cloud Cover in SLC Area 1/20 – 1/27/05 Olympus Cove 5600’29 – 32oF Highs Sugarhouse 4400’32 – 33oF Highs
World Distribution of TemperaturesAnnual Range(highest monthly ave. minus lowest monthly ave.)
Chapter 3 END