Download
1 / 5
50 likes | 73 Views
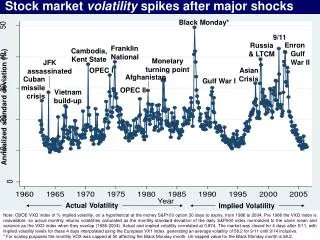
TradingView offers you the largest library of ideas and strategies. Historical, Chaikin, Indicators Volatility. For more information visit on https://zerostockbrokerage.com/volatility-indicators/

E N D
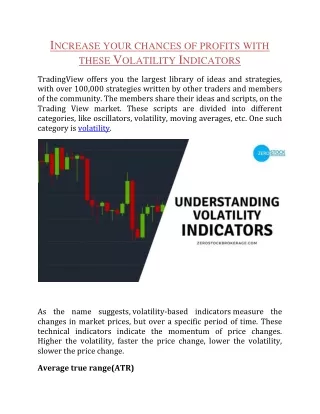
INCREASE YOUR CHANCES OF PROFITS WITH THESE VOLATILITY INDICATORS TradingView offers you the largest library of ideas and strategies, with over 100,000 strategies written by other traders and members of the community. The members share their ideas and scripts, on the Trading View market. These scripts are divided into different categories, like oscillators, volatility, moving averages, etc. One such category is volatility. As the name suggests, volatility-based indicators measure the changes in market prices, but over a specific period of time. These technical indicators indicate the momentum of price changes. Higher the volatility, faster the price change, lower the volatility, slower the price change. Average true range(ATR)
Considered to be the most accurate of all the volatility oscillators, ATR measures market volatility. It finds out how much an asset has moved. While most of the other oscillators do not consider the market gap in their calculations, ATR recognizes all the gaps and considers them in its calculations. A stock with high volatility will have a high ATR, while a stock with low volatility, will have a low ATR. Bollinger Bands The Bollinger bands consist of three lines A middle line- usually the middle line as a moving average, typically value to 20. If the market is above this line, it is the support line, if the market is below this mark, it is considered a resistance line. An upper and a lower line based on deviations The bands usually create a price channel around the current price of the market, that can help you determine the next step in the market. Rate of Change(ROC) A basic momentum oscillator, that measures the percent change between two periods. The ROC oscillates around the zero lines, ranging from positive to negative. TradingView allows you to create strategies using the ROC indicator and sare it with your investor community. People can share their views about your strategy, discuss it, or even collaborate with it. Donchian Channels Donchian channel is used to determine bullish and bearish extremes, favoring reversals, overbought and oversold conditions, emerging trends, etc. it uses candlesticks as a timepiece to create is
and lows line of a security, over a set period of time. It comprises of an upper band, a lower band, and a mid-range band. The upper band indicates the highest price of the security, the lower band represents the lowest price of a security. The area bound between the upper band and the lower band is Donchian Channel. Keltner Channels Keltner channel consists of three different bands, the mid-range for the Exponential Moving Average (EMA) of the asset, the upper band being twice the ATR above EMA, and the lower band is two times the ATR below EMA. Average true range(ATR) Considered to be the most accurate of all the volatility oscillators, ATR measures market volatility. It finds out how much an asset has moved. While most of the other oscillators do not consider the market gap in their calculations, ATR recognizes all the gaps and considers them in its calculations. A stock with high volatility will have a high ATR, while a stock with low volatility, will have a low ATR. Bollinger Bands The Bollinger bands consist of three lines A middle line- usually the middle line as a moving average, typically value to 20. If the market is above this line, it is the support line, if the market is below this mark, it is considered a resistance line. An upper and a lower line based on deviations The bands usually create a price channel around the current price of the market, that can help you determine the next step in the market. Rate of Change(ROC)
A basic momentum oscillator, that measures the percent change between two periods. The ROC oscillates around the zero lines, ranging from positive to negative. TradingView allows you to create strategies using the ROC indicator and share it with your investor community. People can share their views about your strategy, discuss it, or even collaborate with it. Donchian Channels Donchian channel is used to determine bullish and bearish extremes, favoring reversals, overbought and oversold conditions, emerging trends, etc. it uses candlesticks as a timepiece to create highs and lows line of a security, over a set period of time. It comprises of an upper band, a lower band, and a mid-range band. The upper band indicates the highest price of the security, the lower band represents the lowest price of a security. The area bound between the upper band and the lower band is Donchian Channel. Keltner Channels Keltner channel consists of three different bands, the mid-range for the Exponential Moving Average (EMA) of the asset, the upper band being twice the ATR above EMA, and the lower band is two times the ATR below EMA. The three bands expand and contract in relation to the volatility. Parabolic Stop and Reverse (PSAR) TradingView has a library of over 100,000+ indicators, one of which is the PSAR indicator PSAR helps you determine if the price of the current stock is likely to reverse or change. The indicators are shown as dots above or below the price. If the price is trending upwards the dots are above the price chart, and if the price is trending downwards, the dots are below the price chart. Historical Volatility
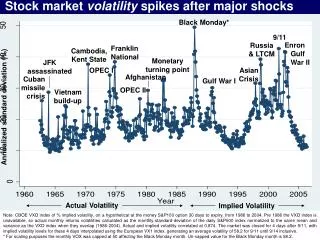
Historical volatility calculates the dispersion of returns over a period of time. In simple words, it calculates how past a stock as moved, over a given period of time. The risk of the security is directly proportional to the historical volatility value, thus, the higher the historical volatility value, the higher the risk of the security. Standard deviation As the name suggests, standard deviation measures how much the price of a stock has moved from its average price, helping you determine the volatility of the price. The value of the indicator is determined by the space/gap between the price and its moving average. Standard deviation is usually combined with Bollinger Bands for effective results. Volatility stop This is an exit indicator, that helps you determine the trends by creating lines, according to the trend. When a red line is created, it indicates the downward position of the trend, the blue line indicating the upward position. Traders need to keep a check on the VSTOP value, because the moment the price crosses the VSTOP value, the trend reverses itself. Chaikin Volatility Chaikin volatility measures the space between the highest and the lowest price of the security. If the oscillator crosses the accumulator-distribution line, it indicates a bullish condition.