Download
1 / 1
10 likes | 85 Views
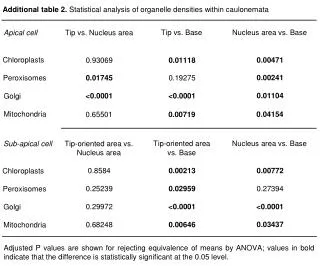
This study conducts statistical analysis on the densities of various organelles within caulonemata to compare their distribution between tip and base regions. Results reveal significant differences in chloroplasts, peroxisomes, Golgi, and mitochondria.

E N D
Additional table 2. Statistical analysis of organelle densities within caulonemata Tip vs. Base Nucleus area vs. Base Apical cell Tip vs. Nucleus area Chloroplasts 0.00471 0.93069 0.01118 0.00241 0.01745 0.19275 Peroxisomes 0.01104 <0.0001 <0.0001 Golgi Mitochondria 0.04154 0.65501 0.00719 Tip-oriented area vs. Base Nucleus area vs. Base Sub-apical cell Tip-oriented area vs. Nucleus area 0.00772 0.8584 0.00213 Chloroplasts 0.27394 0.25239 0.02959 Peroxisomes <0.0001 0.29972 <0.0001 Golgi 0.03437 0.68248 0.00646 Mitochondria Adjusted P values are shown for rejecting equivalence of means by ANOVA; values in bold indicate that the difference is statistically significant at the 0.05 level.