Download
1 / 45
450 likes | 583 Views
This overview introduces foundational concepts in network analysis, highlighting the structural approach to sociology championed by Wellman and Emirbayer. It discusses essential methods including points and lines, data formats, and basic graph theory. Key theoretical debates such as substantialism vs. relationalism, and the implications of structured social relationships on norms and resources are analyzed. This work emphasizes the shift from normative to observed relations, showcasing significant historical roots and offering insights into social network dynamics, causality, and boundary specification within sociological contexts.

E N D
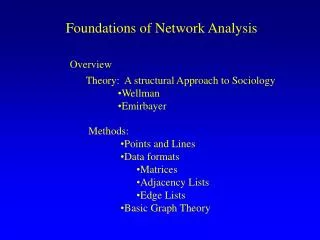
Foundations of Network Analysis Overview • Theory: A structural Approach to Sociology • Wellman • Emirbayer • Methods: • Points and Lines • Data formats • Matrices • Adjacency Lists • Edge Lists • Basic Graph Theory
Homework Results JWM’s 3-step kinship neighborhood (plus in-laws for fun) N=70+
Foundations Theory “A manifesto for Relational Sociology” • “Substantialism vs Relationalism” • Theoretical Domains: • Power, equality, freedom, agency • Substantive domains (research): • Social Structure • Network analysis • Culture • Social Psychology • Problems • Boundary specification • Network dynamics • Causality • Normative implication
Foundations Theory “Structural Analysis: from method and metaphor to theory and substance.” • Five elements: • Structural constraint on activity (as opposed to inner forces) • focus on relations among units (as opposed to categories) • relationships among multiple alters affect people behavior • structure is a network of networks • analytic methods deal with this structure directly • Historical roots: • Social anthropology (Barnes 1954; Bott 1957). Moved from ‘normative’ relations to observed relations. • Early sociologists & Social psychologists start using sociograms (Moreno, Coleman). Focused on details of sociometric structure. • Group around white really pushed the theoretical development of a network perspective as the basis for sociology (late 60s, early 70s)
Foundations Theory “Structural Analysis: from method and metaphor to theory and substance.” H. White: “The presently existing, largely categorical descriptions of social structure have no solid theoretical grounding; furthermore, network concepts may provide the only way to construct a theory of social structure.” (p.25) Integration of large-scale social systems Form Vs. Content
Foundations Theory “Structural Analysis: from method and metaphor to theory and substance.” Major Claims: • Structured social relationships are a more powerful source of sociological explanation than personal attributes of system members. • Norms emerge from location in structured systems of social relationships • Social Structures determine the operation of dyadic relationships • The world is composed of networks, not groups • Structural methods supplant and supplement individualistic methods
Foundations Theory “Structural Analysis: from method and metaphor to theory and substance.” Analytic Principles • Ties are usually asymmetrically reciprocal, differing in content and intensity • Ties link network members indirectly as well as directly. Hence, they must be defined within the context of larger network structures. • Ties are structured, and thus networks are not random, but instead clusters, boundaries and cross-linkages • Cross-linkages connected clusters as well as individuals • Asymmetric ties and complex networks differentially distribute scares resources • Networks structure collaborative and competitive activities to secure scarce resources
Foundations Key Questions • Social Network analysis lets us answer questions about social interdependence. These include: • “Networks as Variables” approaches • Are kids with smoking peers more likely to smoke themselves? • Do unpopular kids get in more trouble than popular kids? • Are people with many weak ties more likely to find a job? • Do central actors control resources? • “Networks as Structures” approaches • What generates hierarchy in social relations? • What network patterns spread diseases most quickly? • How do role sets evolve out of consistent relational activity? • We don’t want to draw this line too sharply: emergent role positions can affect individual outcomes in a ‘variable’ way, and variable approaches constrain relational activity.
Foundations Data The unit of interest in a network are the combined sets of actors and their relations. We represent actors with points and relations with lines. Actors are referred to variously as: Nodes, vertices, actors or points Relations are referred to variously as: Edges, Arcs, Lines, Ties Example: b d a c e
Foundations Data • Social Network data consists of two linked classes of data: • Nodes: Information on the individuals (actors, nodes, points, vertices) • Network nodes are most often people, but can be any other unit capable of being linked to another (schools, countries, organizations, personalities, etc.) • The information about nodes is what we usually collect in standard social science research: demographics, attitudes, behaviors, etc. • Often includes dynamic information about when the node is active • b) Edges: Information on the relations among individuals (lines, edges, arcs) • Records a connection between the nodes in the network • Can be valued, directed (arcs), binary or undirected (edges) • One-mode (direct ties between actors) or two-mode (actors share membership in an organization) • Includes the times when the relation is active • Graph theory notation: G(V,E)
Directed, binary b d Undirected, binary b b d d b d a c e a a c c e e 1 2 1 3 4 a c e Directed, Valued Undirected, Valued Foundations Data In general, a relation can be: (1) Binary or Valued (2) Directed or Undirected The social process of interest will often determine what form your data take. Almost all of the techniques and measures we describe can be generalized across data format.
Primary Group Ego-Net Best Friend Dyad 2-step Partial network Foundations Data Global-Net
Foundations Data We can examine networks across multiple levels: • 1) Ego-network • - Have data on a respondent (ego) and the people they are connected to (alters). Example: 1985 GSS module • - May include estimates of connections among alters • 2) Partial network • - Ego networks plus some amount of tracing to reach contacts of contacts • - Something less than full account of connections among all pairs of actors in the relevant population • - Example: CDC Contact tracing data for STDs
Foundations Data We can examine networks across multiple levels: • 3) Complete or “Global” data • - Data on all actors within a particular (relevant) boundary • - Never exactly complete (due to missing data), but boundaries are set • Example: Coauthorship data among all writers in the social sciences, friendships among all students in a classroom
Foundations Graphs Working with pictures. No standard way to draw a sociogram: each of these are equal:
Foundations Graphs Network visualization helps build intuition, but you have to keep the drawing algorithm in mind: Spring-embeder layouts Tree-Based layouts Most effective for very sparse, regular graphs. Very useful when relations are strongly directed, such as organization charts, internet connections, Most effective with graphs that have a strong community structure (clustering, etc). Provides a very clear correspondence between social distance and plotted distance Two images of the same network
Foundations Graphs Network visualization helps build intuition, but you have to keep the drawing algorithm in mind: Spring-embeder layouts Tree-Based layouts Two images of the same network
Foundations Graphs • Network visualization helps build intuition, but you have to keep the drawing algorithm in mind. • Hierarchy & Tree models • Use optimization routines to add meaning to the “Y-axis” of the plot. This makes it possible to easily see who is most central because of who is on the top of the figure. Usually includes some routine for minimizing line-crossing. • Spring Embedder layouts • Work on an analogy to a physical system: ties connecting a pair have ‘springs’ that pull them together. Unconnected nodes have springs that push them apart. The resulting image reflects the balance of these two features. This usually creates a correspondence between physical closeness and network distance.
Foundations Graphs
Foundations Graphs Using colors to code attributes makes it simpler to compare attributes to relations. Here we can assess the effectiveness of two different clustering routines on a school friendship network.
Foundations Graphs As networks increase in size, the effectiveness of a point-and-line display diminishes, because you simply run out of plotting dimensions. I’ve found that you can still get some insight by using the ‘overlap’ that results in from a space-based layout as information. Here you see the clustering evident in movie co-staring for about 8000 actors.
Foundations Graphs As networks increase in size, the effectiveness of a point-and-line display diminishes, because you simply run out of plotting dimensions. I’ve found that you can still get some insight by using the ‘overlap’ that results in from a space-based layout as information. This figure contains over 29,000 social science authors. The two dense regions reflect different topics.
Foundations Graphs As networks increase in size, the effectiveness of a point-and-line display diminishes, because you simply run out of plotting dimensions. I’ve found that you can still get some insight by using the ‘overlap’ that results in from a space-based layout as information. This figure contains over 29,000 social science authors. The two dense regions reflect different topics.
Foundations Graphs Adding time to social networks is also complicated, as you run out of space to put time in most network figures. One solution is to animate the network. Here we see streaming interaction in a classroom, where the teacher (yellow square) has trouble maintaining order. The SONIA software program (McFarland and Bender-deMoll) will produce these figures. http://www.sociology.ohio-state.edu/jwm/NetMovies/
Foundations Methods Analytically, graphs are cumbersome to work with analytically, though there is a great deal of good work to be done on using visualization to build network intuition. I recommend using layouts that optimize on the feature you are most interested in. The two I use most are a hierarchical layout or a force-directed layout are best.
a a b b c c d d e e b d b d a a 1 1 a c e a 1 1 c e b b 1 c c 1 1 1 1 1 1 d d 1 1 e e 1 1 1 1 Foundations Methods From pictures to matrices Undirected, binary Directed, binary
a b b a c c b d e d c e e c d a b c d e a 1 1 b 1 c 1 1 1 d 1 1 e 1 1 Foundations Methods From matrices to lists Arc List Adjacency List a b b a b c c b c d c e d c d e e c e d
å X D = - N ( N 1 ) Foundations Basic Measures Basic Measures & A little graph theory For greater detail, see: http://www.analytictech.com/networks/graphtheory.htm Volume The first measure of interest is the simple volume of relations in the system, known as density, which is the average relational value over all dyads. Under most circumstances, it is calculated as:
a b c d e a 1 1 b c 1 1 1 d e 1 1 Foundations Basic Measures Basic Measures & A little graph theory Volume At the individual level, volume is the number of relations, sent or received, equal to the row and column sums of the adjacency matrix. Node In-Degree Out-Degree a 1 1 b 2 1 c 1 3 d 2 0 e 1 2 Mean: 7/5 7/5
b f c e d Foundations Data Basic Measures & A little graph theory Reachability Indirect connections are what make networks systems. One actor can reach another if there is a path in the graph connecting them. a b d a c e f
W B 1 0 1 0 0 1 0 1 0 1 1 0 Age 13 10 7 8 16 11 a b c d e 0 1 0 0 0 a 1 0 0 0 0 b 0 1 0 1 1 c d 0 0 0 0 0 0 0 1 1 0 e Foundations Basic Matrix Operations One of the key advantages to storing networks as matrices is that we can use all of the tools from linear algebra on the socio-matrix. Some of the basics matrix manipulations that we use are as follows: • Definition • A matrix is any rectangular array of numbers. We refer to the matrix dimension as the number of rows and columns (5 x 5) (5x2) (5x1)
Foundations Basic Matrix Operations Matrix operations work on the elements of the matrix in particular ways. To do so, the matrices must be conformable. That means the sizes allow the operation. For addition (+), subtraction (-), or elementwise multiplication (#), both matrices must have the same number of rows and columns. For these operations, the matrix value is the operation applied to the corresponding cell values. -1 0 -3 6 2 1 3 6 11 8 2 9 1 3 4 7 2 5 2 3 7 1 0 4 A-B = A+B = A= B= 2 9 28 7 0 20 3 9 12 21 6 15 A#B = Multiplication by a scalar: 3A =
Foundations Basic Matrix Operations The transpose (` or T) of a matrix reverses the row and column dimensions. Atij=Aji So a M x N matrix becomes an N x M matrix. T a b c d e f a c e b d f =
Foundations Basic Matrix Operations The matrix multiplication (x) of two matrices involves all elements of the matrix, and will often result in a matrix of new dimensions. In general, to be conformable, the inner dimension of both matrices must match. So: A3x2 x B2x3 = C3 x 3 But A3x3 x B2x3 is not defined Substantively, adding ‘names’ to the dimensions will help us keep track of what the resulting multiplications mean: So multiplying (send x receive)x (send x receive) = (send x receive), giving us the two-step distances (the sender’s recipient's receivers).
Foundations Basic Matrix Operations The multiplication of two matrices Amxn and Bnxq results in Cmxq a b c d e f g h ae+bg af+bh ce+dg cf+dh = a b c d e f ag+bj ah+bk ai+bl cg+dj ch+dk ci+dl eg+fg eh+fk ei+fl g h i j k l = (3x2) (2x3) (3x3)
Foundations Basic Matrix Operations The powers (square, cube, etc) of a matrix are just the matrix times itself that many times. A2 =AA or A3 = AAA We often use matrix multiplication to find types of people one is tied to, since the ‘1’ in the adjacency matrix effectively captures just the people each row is connected to.
Foundations Data Basic Measures & A little graph theory Reachability The distance from one actor to another is the shortest path between them, known as the geodesic distance. If there is at least one path connecting every pair of actors in the graph, the graph is connected and is called a component. Two paths are independent if they only have the two end-nodes in common. If a graph has two independent paths between every pair, it is biconnected, and called a bicomponent. Similarly for three paths, four, etc.
X3 0 4 0 2 2 4 4 0 6 1 1 0 0 6 2 5 5 6 2 1 5 2 3 1 2 1 5 3 2 1 4 0 6 1 1 0 X 0 1 0 0 0 1 1 0 1 0 0 0 0 1 0 1 1 1 0 0 1 0 1 0 0 0 1 1 0 0 1 0 1 0 0 0 X2 2 0 2 0 0 0 0 2 0 1 1 2 2 0 4 1 1 0 0 1 1 2 1 1 0 1 1 1 2 1 0 2 0 1 1 2 e d Distance . 1 2 0 0 1 1 . 1 2 2 2 2 1 . 1 1 1 0 2 1 . 1 2 0 2 1 1 . 2 1 2 1 2 2 . Distance . 1 2 3 3 1 1 . 1 2 2 2 2 1 . 1 1 1 3 2 1 . 1 2 3 2 1 1 . 2 1 2 1 2 2 . c f b a Foundations Data Basic Measures & A little graph theory Calculate reachability through matrix multiplication. (see p.162 of W&F)
X(Race) 2 0 1 1 2 2 0 2 0 2 1 1 X 0 1 0 0 0 1 1 0 1 0 0 0 0 1 0 1 1 1 0 0 1 0 1 0 0 0 1 1 0 0 1 0 1 0 0 0 Race 1 0 1 0 0 1 0 1 0 1 1 0 R G R G 4 2 2 6 Race`(X)Race= Foundations Data Basic Measures & A little graph theory Mixing patterns Matrices make it easy to look at mixing patterns: connections among types of nodes. Simply multiply an indicator of category by the adjacency matrix. e d c f b a
Foundations Data Basic Measures & A little graph theory Matrix manipulations allow you to look at direction of ties, and distinguish symmetric from asymmetric ties. To transform an asymmetric graph to a symmetric graph, add it to its transpose. X 0 1 0 0 0 1 0 0 0 0 0 1 0 1 1 0 0 0 0 0 0 0 1 1 0 XT 0 1 0 0 0 1 0 1 0 0 0 0 0 0 1 0 0 1 0 1 0 0 1 0 0 Max Sym MIN Sym 0 1 0 0 0 0 1 0 0 0 1 0 1 0 0 1 0 0 0 0 0 1 0 1 1 0 0 0 0 1 0 0 1 0 1 0 0 0 0 0 0 0 1 1 0 0 0 1 0 0 0 2 0 0 0 2 0 1 0 0 0 1 0 1 2 0 0 1 0 1 0 0 2 1 0
Foundations Software • UCINET • The Standard network analysis program, runs in Windows • Good for computing measures of network topography for single nets • Input-Output of data is a special 2-file format, but is now able to read PAJEK files directly. • Not optimal for large networks • Available from: • Analytic Technologies
Foundations Software • PAJEK • Program for analyzing and plotting very large networks • Intuitive windows interface • Used for most of the real data plots in this presentation • Started mainly a graphics program, but has expanded to a wide range of analytic capabilities • Can link to the R statistical package • Free • Available from:
Foundations Software • Cyram Netminer for Windows • Newest Product, not yet widely used • Price range depends on application • Limited to smaller networks O(100) http://www.netminer.com/NetMiner/home_01.jsp
Foundations Software • NetDraw • Also very new, but by one of the best known names in network analysis software. • Free • Limited to smaller networks O(100)
Foundations Software • NEGOPY • Program designed to identify cohesive sub-groups in a network, based on the relative density of ties. • DOS based program, need to have data in arc-list format • Moving the results back into an analysis program is difficult. • Available from: • William D. Richards • http://www.sfu.ca/~richards/Pages/negopy.htm • SPAN - Sas Programs for Analyzing Networks (Moody, ongoing) • is a collection of IML and Macro programs that allow one to: • a) create network data structures from nomination data • b) import/export data to/from the other network programs • c) calculate measures of network pattern and composition • d) analyze network models • Allows one to work with multiple, large networks • Easy to move from creating measures to analyzing data • Available by sending an email to: • Moody.77@sociology.osu.edu