Download
1 / 3
30 likes | 126 Views
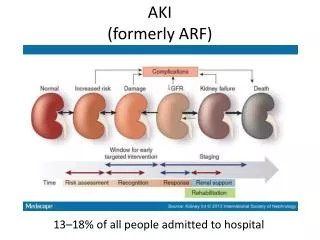
This digital content illustrates adipose tissue areas in different stages of acute kidney injury (AKI). It compares visceral and subcutaneous adipose tissue areas along with body mass index (BMI). The figures show trends and statistical significance. Find insights into AKI-related adiposity changes.

E N D
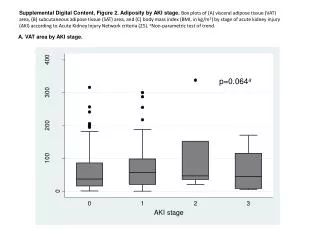
Supplemental Digital Content, Figure 2. Adiposity by AKI stage. Box plots of (A) visceral adipose tissue (VAT) area, (B) subcutaneous adipose tissue (SAT) area, and (C) body mass index (BMI, in kg/m2) by stage of acute kidney injury (AKI) according to Acute Kidney Injury Network criteria (25). aNon-parametric test of trend. A. VAT area by AKI stage. p=0.064a
Supplemental Digital Content, Figure 2 (continued). Adiposity by AKI stage. B. SAT area by AKI stage. p=0.051a
Supplemental Digital Content, Figure 2 (continued). Adiposity by AKI stage. C. BMI by AKI stage. p=0.001a