Download
1 / 51
510 likes | 646 Views
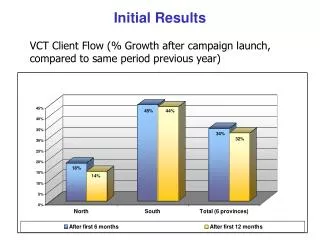
Wind , Thermal, and Earthquake Monitoring of the Watts Towers Initial Results. Ertugrul Taciroglu , UCLA Engineering Bob Nigbor, NEES@UCLA Jackson English, UCLA Engineering The NEES@UCLA Staff. Today’s Agenda. UCLA presentation of initial results Discussion of LACMA monitoring data

E N D
Wind, Thermal, and Earthquake Monitoring of the Watts Towers Initial Results ErtugrulTaciroglu, UCLA Engineering Bob Nigbor, NEES@UCLA Jackson English, UCLA Engineering The NEES@UCLA Staff NEES at Watts Towers, 4/23/2013
Today’s Agenda UCLA presentation of initial results Discussion of LACMA monitoring data UCLA’s project plan – Further monitoring, analysis & modeling LACMA’s project plan Discussion of how UCLA can best contribute to LACMA’s effort Discussion of “products” NEES at Watts Towers, 4/23/2013
LACMA Monitoring Custom crack & temperature monitoring system installed September 2012 with help from Harry Jones of Texas Measurements Three cracks monitored Weather monitoring system installed 2012? On top of site storage container NEES at Watts Towers, 4/23/2013
UCLA Monitoring Initial system installed January 30, acceleration and tilt at ~10m on main tower Additional crack displacement (2) and wind sensor installed March 11 Crack displacement sensor power cleaned up on April 8 – now can see daily movement NEES at Watts Towers, 4/23/2013
Data Description All sensor signals sampled at 200 times/second with very high resolution digitizer Data timing synchronized within 10 microseconds to absolute time (Universal Time coordinated (UTC), also called GMT) using GPS signals Data recorded continuously in 1-hour blocks on local PC in LACMA trailer Remote access possible (but slow and intermittent)through cellular broadband NEES at Watts Towers, 4/23/2013
Sample 1-hr AccelerationRaw Data NEES at Watts Towers, 4/23/2013
Sample 1-hr Raw Tilt Data NEES at Watts Towers, 4/23/2013
Sample 1-hr Temperature Raw Data NEES at Watts Towers, 4/23/2013
Initial Analysis Quality check on all 1-hour data files Take 1-hour averages of all data (means except root-mean-square for acceleration) Extract dominant frequencies (“notes, fundamental & overtones”) from acceleration Look for patterns & trends NEES at Watts Towers, 4/23/2013
Acceleration Analysis NEES at Watts Towers, 4/23/2013
Spectrogram/Sonogram of acceleration, showing frequency (“tone”) content over 1 hour For comparison, Middle C is 262Hz, lowest piano note (double pedal A) is 28Hz NEES at Watts Towers, 4/23/2013
Frequencies (modes) of the main tower are at 2.2, 3.7, 6.5 Hz in the N-S direction. Vibration is complex in E-W direction due to coupling with other towers. NEES at Watts Towers, 4/23/2013
Temperature variation of first mode/note in N-S direction NEES at Watts Towers, 4/23/2013
Temperature variation of 3rd mode/note in E-W direction NEES at Watts Towers, 4/23/2013
Observations on Vibration Behavior Main tower vibration behavior is simple in N-S direction but complex in E-W direction Lowest modes/notes are 2.3Hz N-S and 2.6Hz in E-W direction Structure is stiffer in E-W direction Modes are quite frequency dependent, indicating a temperature dependant stiffness. NEES at Watts Towers, 4/23/2013
Tilt Analysis NEES at Watts Towers, 4/23/2013
Sample North Tilt, 1-hour NEES at Watts Towers, 4/23/2013
Sample West Tilt, 1-hour NEES at Watts Towers, 4/23/2013
North Tilt and Temperature vs. Time in Hours NEES at Watts Towers, 4/23/2013
North Tilt and Temperature vs. Time in Hours NEES at Watts Towers, 4/23/2013
Observations on Tilt Behavior The main tower tracks the sun, leaning away from the sunny side Daily variation .01 to .1 degree There may be a longer trend associated with average temperature, but we’re not sure if this is a measurement artifact. More data are needed, especially from summer temperatures. NEES at Watts Towers, 4/23/2013
Crack Displacement/Movement Analysis NEES at Watts Towers, 4/23/2013
North Crack Displacement and Temperature NEES at Watts Towers, 4/23/2013
South Crack Displacement and Temperature NEES at Watts Towers, 4/23/2013
Sample Daily Crack Cycling NEES at Watts Towers, 4/23/2013
Wind Analysis NEES at Watts Towers, 4/23/2013
Looking for Wind-Related Trends in Tilt Behavior NEES at Watts Towers, 4/23/2013
Looking for Wind-Related Trends in Dynamic Behavior NEES at Watts Towers, 4/23/2013
Observations on Crack Behavior After the power supply was changed on 4/8 we have the resolution to measure daily variations Crack movement correlates with temperature on a daily basis, with different behavior on the two cracks There may be longer trends in the data, but we’re not sure if it is real or a measurement artifact Daily movement of the north crack is about 0.005 inch (0.01mm) Daily movement of the south crack is about 0.01 inch (0.02mm) NEES at Watts Towers, 4/23/2013
UCLA Structure Modeling • Computer modeling not yet started • We anticipate two model types: • Dynamic model to look at wind & earthquake behavior • Static model to study global temperature effects NEES at Watts Towers, 4/23/2013
Initial Comparisons of UCLA and LACMA Data NEES at Watts Towers, 4/23/2013
Temperature, LACMA & UCLA NEES at Watts Towers, 4/23/2013
Wind Speed, LACMA (5-minute) & UCLA (1-hr) NEES at Watts Towers, 4/23/2013
LACMA South Crack UB-5A (Displacement in mm) NEES at Watts Towers, 4/23/2013
UCLA South Crack Displacement (inch) NEES at Watts Towers, 4/23/2013
LACMA PI Data (Displacement in mm) NEES at Watts Towers, 4/23/2013
LACMA Test Plate UB-5A Data NEES at Watts Towers, 4/23/2013
LACMA Test Plate PI-2 Data NEES at Watts Towers, 4/23/2013
Further data needed for LACMA & UCLA crack data comparison Get April data from LACMA for comparison with post-April 8 UCLA data Directly compare both daily variation & long-term “drift” Is the long-term signal real? NEES at Watts Towers, 4/23/2013
Earthquake Data M4.7 near Anza on March 11, 172km from Watts Towers M2.3 near Manhattan Beach on March 23, 16km from Watts Towers NEES at Watts Towers, 4/23/2013
Preliminary Observations Summary Thermal effects are clear: tilt, structural frequency/stiffness, and crack movement change with temperature Solar heating (as opposed to air temperature) may dominate tilt and crack movement Vibrations from moderate wind and small earthquakes are much less than thermal affects NEES at Watts Towers, 4/23/2013
Discussion questions Are these results useful to LACMA, and how can they be more useful to the project? How do we validate the crack data from both LACMA & UCLA, especially the longer trends? Thermal behavior seems to govern the movement of the structure and cracks. What can we do together to better understand this? NEES at Watts Towers, 4/23/2013