Download
1 / 61
610 likes | 757 Views
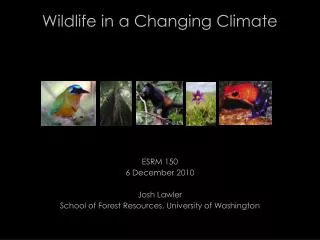
Wildlife in a Changing Climate ESRM 150 6 December 2010 Josh Lawler School of Forest Resources, University of Washington. Climate Change. IPCC 2007. IPCC 2007. IPCC 2007. Average global temperatures have risen 0.74 °C in past 100 years. IPCC 2007. Temperature trends 1979-2005.

E N D
Wildlife in a Changing Climate ESRM 150 6 December 2010 Josh Lawler School of Forest Resources, University of Washington
Average global temperatures have risen 0.74 °C in past 100 years IPCC 2007
Temperature trends 1979-2005 IPCC 2007
Temperatures predicted to rise 1.1 – 6.4 °C over the next 100 years (IPCC) IPCC 2007
SRES A2 2020-2029 2090-2099 IPCC 2007
Projected % change in precipitation 1980-1999 to 2090-2999 (IPCC) IPCC 2007
Climate Change Impacts • “We are not talking any more about what climate models say might happen in the future. We are experiencing dangerous human disruption of the global climate and we are going to experience more.” • – John Holdren, Past President, American Association for the Advancement of Science (Harrabin, BBC, 8/31/06)
Grinnell Glacier, Glacier National Park, Montana 1938 1981 110 glaciers have disappeared From GNP in the past 150 years Remaining 37 glaciers estimated to be gone by 2050 (Glacier National Park, www.nps.gov/glac) Key et al. 2002. Glacier retreat in Glacier National Park, Montana. In: Williams & Ferrigno (eds.) Satellite image atlas of glaciers of the world, Chapter J, Glaciers of North America. USGS Prof. Paper 1386-J.
Trends in snow pack UW Climate Impacts Group
Projected changes in April 1st snowpack UW Climate Impacts Group * Measured as SWE Historic = 1916-2006 average
Sensitive watersheds Hamlet 2007
Area burned is projected to double by 2040 and triple by 2080. Probability of more than 2M acres burning in a single year: historic 5% 2080 33% UW Climate Impacts Group, Littell 2009
Sea-level Rise Global: 0.2 - 0.6 m by 2100 (IPCC 2007) Puget Sound: 0.15 – 1.27 m by 2100 (UW CIG) Photo: Dr. W. Glamore
Sea-level Rise +5 meters
Modeling Shifts in Biota Climate projections Biotic distributions Bioclimatic models GCMs
Historical Climate – MC1 Simulation (With Fire) Ron Neilson, USFS
HADCM3-A Ron Neilson, USFS
Environmental Change Research Group, Dept. of Geography, Univ. of Oregon. Climate data: CRU CL 1.0 (New et al. 1999); CRU data interpolation: P. J. Bartlein (Univ. of Oregon); HadCM2 (Mitchell and Johns 1997). Soil data: CONUS-SOIL (Miller and White 1998); Vegetation model: BIOME4 (Kaplan 2001), modified by S. Shafer (USGS).
Environmental Change Research Group, Dept. of Geography, Univ. of Oregon. Climate data: CRU CL 1.0 (New et al. 1999); CRU data interpolation: P. J. Bartlein (Univ. of Oregon); HadCM2 (Mitchell and Johns 1997). Soil data: CONUS-SOIL (Miller and White 1998); Vegetation model: BIOME4 (Kaplan 2001), modified by S. Shafer (USGS).
Environmental Change Research Group, Dept. of Geography, Univ. of Oregon. Climate data: CRU CL 1.0 (New et al. 1999); CRU data interpolation: P. J. Bartlein (Univ. of Oregon); HadCM2 (Mitchell and Johns 1997). Soil data: CONUS-SOIL (Miller and White 1998); Vegetation model: BIOME4 (Kaplan 2001), modified by S. Shafer (USGS).
Environmental Change Research Group, Dept. of Geography, Univ. of Oregon. Climate data: CRU CL 1.0 (New et al. 1999); CRU data interpolation: P. J. Bartlein (Univ. of Oregon); HadCM2 (Mitchell and Johns 1997). Soil data: CONUS-SOIL (Miller and White 1998); Vegetation model: BIOME4 (Kaplan 2001), modified by S. Shafer (USGS).
stable expansion contraction Northern Flying Squirrel (HADCM3 A1B)
stable expansion contraction Douglas Squirrel (HADCM3 A1B)
stable expansion contraction Northern Goshawk (HADCM3 A1B)
Species change lower (B1) mid (A1B) mid-high (A2) 0 10 20 30 40 50 60 70 80 90 275 % change
“to conserve the scenery and the natural and historic objects and the wildlife therein and to provide for the enjoyment of the same in such manner and by such means as will leave them unimpaired for the enjoyment of future generations.” - U.S. National Park System Organic Act
Everglades NP North Cascades NP Species Change in National Parks Max = 61% Mean = 22% (sd= 9%) Min = 8% % Change Parks
Species Change in National Parks % Change Parks