Foreign Exchange Markets
Chapter 5. Foreign Exchange Markets. Unit II Financial Markets and Instruments. Fundamental Issues. What are foreign exchange markets? What determines exchange rates? What distinguishes nominal and real exchange rates?

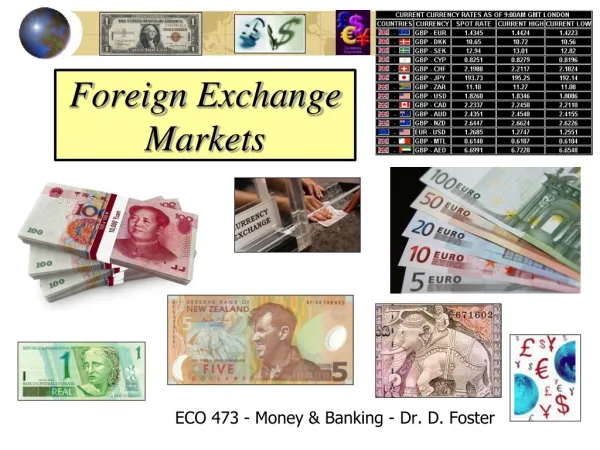
Foreign Exchange Markets
E N D
Presentation Transcript
Chapter 5 Foreign Exchange Markets Unit II Financial Markets and Instruments PowerPoint Presentation by Charlie CookThe University of West Alabama
Fundamental Issues • What are foreign exchange markets? • What determines exchange rates? • What distinguishes nominal and real exchange rates? • What is purchasing power parity, and is it useful as a guide to movements in exchange rates? • What are the special risks of holding international financial instruments? • In what ways can exchange rates and interest rates be related? © 2006 Thomson Business and Professional Publishing. All rights reserved.
Exchange Rates and the Market for Foreign Exchange • Foreign exchange: • Exchange of currencies issued by different countries. • Foreign exchange market: • A system of private banks, foreign exchange brokers and dealers, and central banks through which households, businesses, and governments purchase and sell currencies of various nations. • Large banks like Citibank and Chase are major players in this market. © 2006 Thomson Business and Professional Publishing. All rights reserved.
Why do nations trade currencies? • The market for foreign exchange is a derived demand, that is, derived from the demand for good, services, and assets that people in other countries use the currency to buy. • Example: US citizens buy Nintendo games: Nintendo is a Japanese company. While we pay for these games in US dollars, Nintendo does not really want those dollars. Why not? © 2006 Thomson Business and Professional Publishing. All rights reserved.
Foreign Exchange Markets and Spot Exchange Rates • Spot market: • A market for contracts requiring the immediate sale or purchase of an asset. • Spot exchange rate: • The spot-market price of a currency indicating how much of one country’s currency must be given up in immediate exchange for a unit of another nation’s currency. © 2006 Thomson Business and Professional Publishing. All rights reserved.
Foreign Exchange Markets and Spot Exchange Rates (cont’d) • Appreciation: • A rise in the value of one currency relative to another. • Depreciation: • A decline in the value of one currency relative to another. © 2006 Thomson Business and Professional Publishing. All rights reserved.
Exchange Rates S 1/S Monetary U.S. Dollar Currency per Country Unit Equivalent U.S. Dollar European Monetary Union Euro 1.2113 0.8256 3-month forward 1.2154 0.8228 6-month forward 1.2208 0.8191 Australia Dollar 0.7783 1.2849 Brazil Real 0.4203 2.3790 Canada Dollar 0.8123 1.2310 China, P.R. Yuan 0.1208 8.2765 Denmark Krone 0.1629 6.1370 Hong Kong Dollar 0.1287 7.7711 India Rupee 0.0230 43.5000 Japan Yen 0.0092 108.66 3-month forward 0.0093 107.68 6-month forward 0.0094 106.66 Malaysia Ringgit 0.2632 3.8000 Mexico Peso 0.0927 10.7905 © 2006 Thomson Business and Professional Publishing. All rights reserved. Table 5–1 SOURCE: :Federal Reserve Bank of New York, June 21,2002.
Using the table: • Consider the Euro: • 1 EUR = 1.2113 USD, or, dividing both sides by 1.2113 gives: • 1 USD = .8256 EUR( on June 5, 2005) • More recently, we have, on Feb. 5, 2007: • 1 USD = 0.773407 EUR, 1 EUR = 1.29298 USD • Thus we say the dollar has depreciated against the Euro, or alternatively the Euro has appreciated against the dollar. © 2006 Thomson Business and Professional Publishing. All rights reserved.
Using the table: • In the table, let S = the US dollar equivalent exchange rate, so the last column is 1/S, the currency per US dollar. • Thus if S rises (so 1/S falls), the US dollar is depreciating against the foreign currency in question. © 2006 Thomson Business and Professional Publishing. All rights reserved.
Finding and calculating exchange rates • Use the following web site to find exchange rates: • http://www.xe.com/ucc/ © 2006 Thomson Business and Professional Publishing. All rights reserved.
Average Daily Trading in Foreign Exchange Markets © 2006 Thomson Business and Professional Publishing. All rights reserved. Figure 5–1 SOURCE: Bank for International Settlements.
What determines exchange rates of currencies? • In most cases these days, the answer is supply and demand. • Recall supply and demand from basic economics: together, they determine the equilibrium price. • Using the books example, consider the demand for British pounds. © 2006 Thomson Business and Professional Publishing. All rights reserved.
Demand for the Pound Demand for a currency is derived from the demand for the goods, services, and assets that residents of other countries use the currency to purchase. © 2006 Thomson Business and Professional Publishing. All rights reserved. Figure 5–2
Demand for the pound • Note on the graph we are measuring, on the vertical axis, the number of dollars it takes to get a British pound. Thus if the dollar appreciates, it takes fewer dollars to buy a pound, and thus the exchange rate falls, say from SA to SB. If the dollar depreciates, its takes more dollars to buy a pound, and thus the exchange rate rises, say from SB to SA.Thus a change in the exchange rate is represented by a movement along the demand curve. © 2006 Thomson Business and Professional Publishing. All rights reserved.
Demand for the Pound A reduction in the exchange rate from SA to SB means an appreciation of the dollar relative to the pound, which makes British goods cheaper for US consumers. Thus the quantity demanded of pounds by US residents increases from QA to QB. © 2006 Thomson Business and Professional Publishing. All rights reserved. Figure 5–2
An Increase in Currency Demand A change in the demand for a currency is reflected by a shift in the demand schedule. © 2006 Thomson Business and Professional Publishing. All rights reserved. Figure 5–3
Shifts in the currency demand curve • What causes shifts in currency demand? • Factors other than the exchange rate that will change the demand for British pounds, such as a change in tastes of US consumers for British goods, or a change in income in the US, or a change in a countries import restrictions. • For example, suppose US consumers develop a greater taste for British goods at any exchange rate: this leads to a rightward shift in the demand for British pounds. © 2006 Thomson Business and Professional Publishing. All rights reserved.
The Supply of a currency • Where does the supply of British pounds come from? British consumers demand US dollars, stemming from their demand for our goods, services, and assets. This generates a supply of pounds. © 2006 Thomson Business and Professional Publishing. All rights reserved.
The Currency Supply Schedule In panel A, A fall in the pound-dollar exchange rate induces an increase in the quantity of dollars demanded, shown by the movement from point A to point B. © 2006 Thomson Business and Professional Publishing. All rights reserved. Figure 5–4
The Currency Supply Schedule In panel B, As the British use more pounds to purchase dollars, they supply a larger quantity of pounds. Thus the rise in the dollar-pound exchange rate leads to an increase in the quantity of pounds supplied, an upward sloping supply curve. © 2006 Thomson Business and Professional Publishing. All rights reserved. Figure 5–4
A Reduction in Currency Supply If British residents reduce their desired consumption of U.S. goods and services, then they supply fewer pounds in exchange for dollars at any given exchange rate. Thus, the currency supply schedule shifts leftward. © 2006 Thomson Business and Professional Publishing. All rights reserved. Figure 5–5
Shifts in the currency supply curve • What causes shifts in currency supply? The same factors that cause a shift in a countries demand for foreign good and services also shifts the supply of its currency. Thus a change in Britain’s tastes for US goods, or a change in British income could lead to a change in the supply of pounds. © 2006 Thomson Business and Professional Publishing. All rights reserved.
The Equilibrium Exchange Rate • The equilibrium exchange rate: • The rate at which the quantity of a currency demanded is equal to the quantity supplied. • At the equilibrium exchange rate, the foreign exchange market clears, meaning that the quantity of the currency demanded is exactly equal to the quantity supplied. © 2006 Thomson Business and Professional Publishing. All rights reserved.
Foreign Exchange Market Equilibrium © 2006 Thomson Business and Professional Publishing. All rights reserved. Figure 5–6
Foreign Exchange Market Equilibrium • At SA, an above equilibrium rate, quantity of pounds supplied exceeds the quantity demanded: thus we have an excess supply of pounds, which leads sellers to bid down the exchange rate. • At SB, a below equilibrium rate, quantity of pounds demanded exceeds the quantity supplied: thus we have an excess demand for pounds, which leads buyers to bid up the exchange rate. • Thus the market tends to move to equilibrium. • Shifts in the demand or supply curves can change the equilibrium. © 2006 Thomson Business and Professional Publishing. All rights reserved.
An Increase in the Equilibrium Exchange Rate © 2006 Thomson Business and Professional Publishing. All rights reserved. Figure 5–7
An Increase in the Equilibrium Exchange Rate • What could cause say a rise in the exchange rate? • An increase in the demand for pounds, say due to greater US demand for British goods • Or, a decrease in the supply of pounds, say due to a decrease in British demand for US goods. © 2006 Thomson Business and Professional Publishing. All rights reserved.
Foreign currency trading on the web • http://www.fxcm.com/?engine=adm+val&keyword=foreign+currency+trading&CMP=SFS-70160000000CeL0AAK • Concerns over such trading: see the box on page 101. © 2006 Thomson Business and Professional Publishing. All rights reserved.
Currency Valuations • Often on the news, etc, will hear someone comment that a particular currency is “over” or “under” valued. However it is not always clear what that means, or how this conclusion was reached. Some economists attempt to answer this based on the theory of purchasing power parity. © 2006 Thomson Business and Professional Publishing. All rights reserved.
Currency Valuations • Overvalued currency: • A currency whose present market-determined value is higher than the value predicted by an economic theory or model. • Undervalued currency: • A currency whose present market-determined value is lower than that predicted by an economic theory or model. © 2006 Thomson Business and Professional Publishing. All rights reserved.
Exchange Rates • Nominal exchange rate: • An exchange rate that is unadjusted for changes in the two nations’ price levels. The rates we looked at earlier were nominal rates. • Real exchange rate: • An exchange rate that has been adjusted for differences between two nations’ price levels, thereby yielding the implied rate of exchange of goods and services between those nations. © 2006 Thomson Business and Professional Publishing. All rights reserved.
Real exchange rates • Can get the real exchange rate by taking the nominal rate times the ratio of the countries price levels. • RER (real exchange rate) = S x P*/P Where P = the price level in the domestic country, P * equals the price level in the foreign country, and S is the US dollar equivalent exchange rate. © 2006 Thomson Business and Professional Publishing. All rights reserved.
Purchasing Power Parity • Purchasing power parity (PPP): • A condition that states that if international arbitrage is unhindered, the price of a good or service in one nation should be the same as the exchange-rate-adjusted price of the same good or service in another nation. • For this reason, economists often refer to the concept of purchasing power parity as the law of one price. • Arbitrage: • Purchasing an asset at the current price in one market and profiting by selling it at a higher price in another market. © 2006 Thomson Business and Professional Publishing. All rights reserved.
Purchasing Power Parity (cont’d) • Absolute purchasing power parity: • One nation’s price of a good should equal another nation’s price for that good times the spot exchange rate. • Can be defined as: Where P = the price of the good in the domestic country, P * equals the price in the foreign country, and S is the US dollar equivalent exchange rate. © 2006 Thomson Business and Professional Publishing. All rights reserved.
Purchasing Power Parity (cont’d) • Example: Suppose a tv in Detroit costs $500, and the US dollar equivalent exchange rate is .8 US dollars to each Canadian dollar. Then the Canadian price, P* should equal P/.8, or 500/.8 = 625 Canadian dollars. © 2006 Thomson Business and Professional Publishing. All rights reserved.
Purchasing Power Parity (cont’d) • Thus absolute purchasing power parity implies that the price of the same product in 2 countries should be the same, after converting their prices to a common currency. • Thus 625C$ x .8 US$/C$ = $500 in US dollars. © 2006 Thomson Business and Professional Publishing. All rights reserved.
Purchasing Power Parity (cont’d) • Theoretically, what keeps the price and /or exchange rate at this level? Arbitrage, the riskless profit opportunity when prices differ too much. • Suppose the exchange rate was .9,not .8. Then the US price of this tv in Canada is 625x.9 or 562.50. Someone could buy tv’s in the US at $500, sell them in Canada at 625C$ which equals 562.50 US dollars, and make a profit. © 2006 Thomson Business and Professional Publishing. All rights reserved.
Purchasing Power Parity (cont’d) • Thus tvs would flow from Detroit to Windsor, thus increasing the demand for US dollars. Three markets will go through adjustment: more tv’s demanded in Detroit, more tv’s supplied in Windsor, and an increase in the demand for US dollars. Prices and exchange rates would adjust. © 2006 Thomson Business and Professional Publishing. All rights reserved.
A Theory of the Exchange Rate • Spot exchange rate: • The absolute PPP relationship can rearranged to solve for the spot exchange rate: In our example of the US and Canada, if we apply this concept to all goods, it says that the spot exchange rate equals the US price level divided by the Canadian price level. © 2006 Thomson Business and Professional Publishing. All rights reserved.
A Theory of the Exchange Rate • Many problems with this theory: requires assumptions of no transportation costs, no tax differentials between the countries, and no trade restrictions. Also the basket of goods between the two countries may be different. If the countries consume different baskets of goods, then the arbitrage example we used earlier does not hold true. © 2006 Thomson Business and Professional Publishing. All rights reserved.
A Theory of the Exchange Rate • Another problem with absolute PPP is that if absolute PPP holds, however, then S = P/P*, so the real exchange rate is equal to one: • Recall that the RER (real exchange rate) • = S x P*/P, substitute in for S from above yields: © 2006 Thomson Business and Professional Publishing. All rights reserved.
A Theory of the Exchange Rate • If the real exchange rate was equal to 1, it means that a basket of goods in the US should exchange for the exact same basket in another country. In other words, on a given day, one US dollar should have the same real purchasing power anywhere in the world. • Highly unlikely that this is the case. This is why the theory of relative purchasing power parity is used more often than absolute purchasing power parity. © 2006 Thomson Business and Professional Publishing. All rights reserved.
Relative Purchasing Power Parity • Relative purchasing power parity: • Relates proportionate changes in exchange rates to relative changes in countries’ price levels: • Relative PPP can also be expressed as the difference between two countries’ inflation rates (denoted as “”): © 2006 Thomson Business and Professional Publishing. All rights reserved.
Relative Purchasing Power Parity • Basically this equation says that if the inflation rate in your country exceeds another country’s inflation rate, your currency should depreciate. • Note that a percentage increase in S means a depreciation of your currency, just as we saw earlier with supply and demand curves. © 2006 Thomson Business and Professional Publishing. All rights reserved.
Relative Purchasing Power Parity • How well does relative PPP perform? Better than absolute PPP, but not very well in short periods of time. • Relative PPP seems to be a better theory of exchange rate changes in the long run. • Still much controversy: the Big Mac index shows that in the short run, PPP does not seem to predict exchange rates very well. © 2006 Thomson Business and Professional Publishing. All rights reserved.
The Big Mac Index •Purchasing power parity; local price divided by price in the United States. †Average of New York,Chicago,San Francisco,and Atlanta. ‡Dollars per pound. §Dollars per euro. © 2006 Thomson Business and Professional Publishing. All rights reserved. Table 5–2 SOURCES: McDonald’s; The Economist.
Risks of Holding International Financial Instruments • Foreign exchange risk: • The potential for the value of a foreign currency-denominated financial instrument to vary because of exchange rate fluctuations. • Three types of foreign exchange risk: © 2006 Thomson Business and Professional Publishing. All rights reserved.
Types of Foreign Exchange Risk Type of Risk How Risk Exposure Arises Transaction risk Commitment to a future transaction denominated in a foreign currency Translation risk Conversion of values of foreign- currency-denominated assets and liabilities into home-currency units Economic risk Changes in underlying asset returns and, thus, discounted future income streams, resulting from exchange rate variations © 2006 Thomson Business and Professional Publishing. All rights reserved. Table 5–3
Risks • Country risk: • The potential for returns on international financial instruments to vary because of uncertainties concerning possible changes in political and economic conditions within a nation. Also called Sovereign risk. Suppose a foreign country declares non-payment of debt held by foreigners for example. © 2006 Thomson Business and Professional Publishing. All rights reserved.
Managing these risks • Note that exchange rate variations can have both positive and negative effects on a saver or company. However, depending on the degree of risk aversion, some people wish to avoid these risks. • International Portfolio Diversification is one way to minimize these effects. For a firm, owning plants in several countries, not just one, might be another strategy. • Also ways to hedge, or offset, these risks. © 2006 Thomson Business and Professional Publishing. All rights reserved.