Download
1 / 60
600 likes | 668 Views
Explore world population distribution and density. Learn about growth rates and factors influencing them in various regions. Discover demographic variations and measures affecting population composition.

E N D
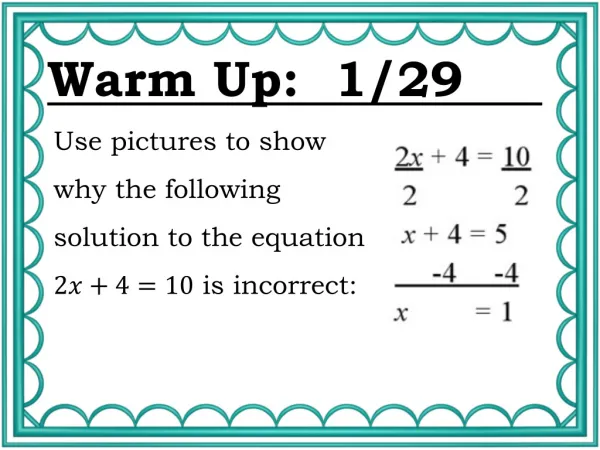
Warm Up 09-29-14 • https://www.youtube.com/watch?v=9_9SutNmfFk • What is at the core of our environmental problem? • What do you notice as the population grows? Give me three examples. • Where is most of the world’s population located?
Population Chapter 2
Key Question: Where in the World do People Live and Why?
Many Ways of Measuring Population: Population Density – Arithmetic Density: measure of total population relative to land size Physiologic Density: Measure of total population to arable (farmable) land Physiologic always more dense!
World Population Density 3 MAJOR CENTERS: East Asia, South Asia and Europe = almost ½ of the world’s poplation
Physiologic Population Density – number of people per unit area of agriculturally productive land (takes this map into account). What are the major differences between this map and the physiologic density maps?
Physiologic Population Density Luxor, Egypt Egypt’s arable lands are along the Nile River Valley. Moving away from the river a few blocks, the land becomes sandy and wind-sculpted.
Population Distribution – Descriptions of locations on the Earth’s surface where individuals or groups (depending on the scale) live. Dot Map of World Population – On this map, one dot represents 100,000 people
World Population Distribution and Density • East Asia - ¼ of world population here • South Asia - bound by the Himalayas and a desert in Pakistan • Europe - population is concentrated in cities • North America - megalopolis
East Asia • (1) ¼ of the World’s Pop • (1) Coastal and Riverine… extremely dense • (2) P & A density very high… Extensively use Ag. Land • (3) Declining growth rates • (4) China 1 child policy
East Asia Continued • (3) Japan Below Replacement level • (3) Korea growing • (5) Developed and Developing… lowering rates • (6) Japan: Urban… low BR, Rural China high BR, Urban China 1 child. • China 40% urban… Japan 78%
South Asia • (1) ¼ of the world’s pop. • (1) India, Pak. & Bang. All Big all Growing • (1)Coastal, & Riverine (Ganges – India, Indus – Pak., Bramaputra – Bang.) • (2) Arith & Phys Density Very high
South Asia Cont. • (3) Growth Rates still high, but slowing. • (4) Pak… Islam = high BR & India…low female status = high BR • (5) Ind., Pak., & Bang., Developing… Semi-Periphery = Higher than average RNI • (6) Ind. 28 % Urb… MANY Farmers… Yet Huge cities. S. Asia less that 30% urb
Population Growth in India • Significant demographic variations occur within countries. • In India, growth rates are higher in the east and northeast.
Why do Growth Rates Vary in India? • 1960s population planning program • 1970s country began forced sterilization program for men with 3 or more children. • 22.5 million men were sterilized. • 2004 state of Uttar Pradesh began guns for sterilization program. • Today, most states use advertising and persuasion to lower birth rates.
Maharashtra, India. A sign reads “free family planning sterlization operation” closed in 1996.
South East Asia • (1) Coastal… Java, Indonesia #4 • (2) More phys. Dense that SA, but less Arith. Dense that SA??? = More farm land in ??? • (3) Rates are falling, but RNI is still over 1% throughout the region…
SE ASIA continued • (4) Islam in Indonesia = higher BR… Women working in foreign owned businesses = lower BR • (5) Income Rising… TNC’S the cause, Literacy rates high… both work to lower BR • (6) Mostly Urban… = lower BR
Western and Central Asia (Stans) • (1) Sparsely populated • (2) No Major densities • (3) 1-2%... High end… Rural, poor, Islam • (4) Islam • (5) Literacy rates High. Low GNI/person • (6) Very Rural… 70%
Europe • (1) #3 in pop. Total by region. People concentrated on coasts, rivers and COAL FIELDS • (2) Very dense in both measures • (3) The wealthier… the lower the BR. Most at or under replacement BR • (4) Urban, wealthy, and advanced status for women cause lower BR… Catholicism losing impacts on BR in Southern Europe
EUROPE Cont. • (5) Wealthy, GEI high, Literacy High = Low BR • (6) Most Urban region in the World… most at 80% or more = Low BR
North Africa and the Middle East • (1) About 600,000,000 people • (2) Nile River region & Mediterranean coast • (3) Still growing, but slower • (4) Islam = higher BR, lower GEI • (5) Wealth growing due to oil, BR falling • (6) Afg. 22%... Kuwait 100%... Predictable
Sub-Saharan Africa • (1) Nigeria & Coastal W. Afr • (2) Mostly sparse… except Nigeria • (3) Most rapidly growing region in world • (4) Low status of Women & lacking education • (5) Poorest region in the world • (6) Least Urban region in the World
Latin America • (1) No Major distributions • (2) Arithmetic density very low, Physilogical moderately high = little arable land • (3) decreasing growth rates, still at 1.5% • (4) Catholicism = more babies • (5) Dev. Status growing in most places • (6) 80% urban… sparsely populated hinterlands due to Jungles • ??? Are there regional variances w/in L.A.?
North America… US & Canada • (1) Megalopolis… BosNYWash… No real continuous clusters • (2) Low & Low Large places for not large amounts of people • (3) Slow to no growth • (4) empowered women = low BR • (5) High GNI = low BR • (6) 80% urb. = low BR • US main pop. Issue = immigration
Populations are falling in some parts of the world. How will Figure 2.5 look different 50 years from now? If you were updating this textbook in 50 years, where would the largest population clusters in the world be?
World Birth Rate – number of births in a year per 1,000 people.
World Population Growth – Rate of natural increase (does not take into account immigration and emigration).
Today, the pace of world population growth is slowing. Where have Total Fertility Rates (TFRs) fallen below replacement level and why?
World Mortality Rate – number of deaths in a year per 1,000 people.
Key Question: Why do Populations Rise or Fall in Particular Places?
A Population Bomb? • Malthus (early 1800s) worried about population growing exponentially and resources growing linearly. • Ehrlich (1960s) warned of a population bomb because the world’s population was outpacing food production.
The Demographic Transition in Great Britain • Studied the change in birth rates, death rates, and natural growth rates over the course of British industrialization. • Found a transition occurred when death rates decline and then birth rates decline, resulting in a low or sustained growth rate.
The Demographic Transition • Stage 1: Low Growth • Stage 2: High Growth • Stage 3: Moderate Growth • Stage 4: Low Growth or Stationary • Stationary population level (SPL)?
Examine Appendix B at the end of your textbook. Study the growth rate column. Which countries have the highest growth rates? Determine what stage of the demographic transition these countries are in, and hypothesize what may lead them to the next stage.
Key Question: Why does Population Composition Matter?
Population Composition Population Composition is concerned with: • Gender distribution • Age distribution within a country, region, or place.
Population Pyramids – Charts that show the percentages of each age group in the total population, divided by gender. For poorer countries, the chart is shaped like a pyramid. Infant mortality rates are high, life expectancy is shorter.
Population Pyramid Terms • Cohort • Dependency Ratio • Age/Gender Distribution… Sex Ratio • Over Population/Underpopulation • Demographic Momentum
Doubling Time as a factor of Growth * define: The amount of time for a given population to double, based on the annual growth rate. To determine doubling time, divide the growth rate as a percentage into 70. i.e., a growth rate of 3.5 represents a doubling time of 20 years.
Doubling Time as a factor of Growth • 1% growth rate = DT of 70 years • 2% growth rate = DT of 35 years • 3% growth rate = DT of 23.5 years • 4% growth rate = DT of 17.7 years • 5% growth rate = DT of 14.2 years • 6% growth rate = DT of 12 years • 7% growth rate = DT of 10 years
Age Structure of a Population • The populations of many countries are aging. - eg. Europe - eg. Japan Bordeaux, France Photo credit: H.J. de Blij
Age Structure of a Population • Dependency Ratio: • In economics and geography the dependency ratio is an age-population ratio of those typically not in the labor force (the dependent part… under 15 and over 65)) and those typically in the labor force (the productive part). It is used to measure the pressure on productive population. • How does this impact society???
Age Structure of a Population • Underpopulation: is usually when a countries' population has declined too much to support its current economic system • How does this impact society???
Demographic Momentum • Phenomenon of a growing population size even after replacement-level fertility has been reached. This occurs when the base of the population pyramid is so wide that the generation of parents will take them to cycle out before zero growth occurs. • In English… A wide based population pyramid has a lot of baby makers and not a lot of folks who are dying. 1.5 kids/family at the bottom will still outpace deaths, creating growth even with low TFR’s.
In poorer countries, Infant Mortality Rates are usually high, which is reflected in the pyramid shape.
In poorer countries, Life Expectancy is usually shorter, which is also reflected in the pyramid shape.
Affect of AIDS on population pyramid for South Africa. Predicted population for 2035, without and with AIDS. With AIDS, looks like a population “chimney.”