Download
1 / 34
340 likes | 407 Views
Improving Wireless Coverage through Intelligent Site Selection. Penn State University GEOG 596A Peer Review Presentation by Adam Nelson Adviser: Jim Detwiler. ABSTRACT. Designers Administrators Technicians . Existing Towers. PUBLIC SAFETY / PUBLIC SERVICE RADIO SYSTEMS

E N D
Improving Wireless Coverage through Intelligent Site Selection Penn State University GEOG 596A Peer Review Presentation by Adam Nelson Adviser: Jim Detwiler
ABSTRACT Designers Administrators Technicians Existing Towers PUBLIC SAFETY / PUBLIC SERVICE RADIO SYSTEMS (Police,Fire,EMS, Utilities)
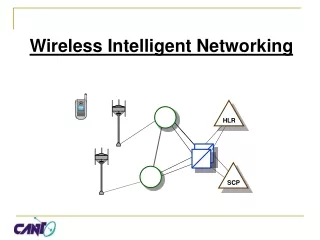
What is Coverage? Wireless radio systems are composed of one or more “Antenna Sites” or “Tower Sites.” Antennas mounted on these structures pump out wireless communications signals via electromagnetic waves. Users receive the outbound signals from the antenna sites, and transmit their own signals (e.g. voice) back to the sites via radios. Areas where this two-way communication can occur are said to be “covered.” Areas where either inbound or outbound directions fail are considered “uncovered.”
What Can Cause Coverage Problems? • Terrain blocking • Weak signals • Aging technologies • Outgrowing the system • Expanded boundaries • Urban sprawl Terrain Blocking Antenna Site Green = Signals are strong No green = Signals are weak or gone altogether
Coverage Problems can be Costly • Can cost lives in public safety systems • Longer outages for utilities • Poor audio • Blocked/dropped calls These Situations Need Communications!
How to Address the Problem • Diagnosis • Personal experience with the system • User reports • Coverage modeling software • Mitigation • Updating system technology • Improving existing equipment • ADDING ANTENNA SITES
Determine Bad Areas Good Coverage Fair Coverage Poor Coverage No Coverage Antenna Sites Coverage Prediction Software Demo
Add Hypothetical Antenna Sites Good Coverage Fair Coverage Poor Coverage No Coverage Coverage Prediction Software Demo
Model the Coverage from the Sites Good Coverage Fair Coverage Poor Coverage No Coverage Coverage Prediction Software Demo
Assess the Potential Coverage Good Coverage Fair Coverage Poor Coverage No Coverage Coverage Prediction Software Demo
What’s Next? • Need to decide: Build new towers for your antennas Look for existing towers to place your antennas or • Looking for existing towers can save money • Land development/ownership • Construction costs • Routing power to facility
Current Ways to Find Existing Antenna Sites • Enlist the help of professional site finders • Expensive • May or may not examine coverage • Agencies can research existing sites on their own • Many disparate databases (e.g. FCC) • Multi-step process • Mostly general radius searches • Sites may not cover the problem area (terrain issues) Location of ideal site Radius Searches 5 mi. 10 mi. 20 mi.
Explanation of the situation Proposed solution
Site Selector Tool (SST) Workflow Determine poor coverage (experience or w/ software) Before SST Choose a point where coverage is poor SST Inputs Choose search criteria (radius, height, existing/new) Find all locations that have Line of Sight (i.e. VIEWSHED) SST Functions Query existing tower/site databases to determine candidates Output existing candidate antenna sites in easily reviewable format SST Outputs Pursue the new antenna sites! After SST
Intended Audience • Agencies with limited resources for site acquisition professionals • State and local governments • Law Enforcement • Fire Departments • Emergency Services • Regional utilities • Design consultants • Not likely for major wireless carriers (Verizon, Sprint, e.g.) • Usually have their own site acquisition departmentsand their own methods • These are not available to the public
Explanation of the situation Proposed solution Viewshed analysis
First step - Viewshed • A viewshed is a collection of points within a given radius from an observation point that have a Line of Sight (LOS) to that point. • Requires Digital Elevation Model (DEM) • For gauging predicted wireless coverage from a proposed antenna site, a viewshed provides a reasonable estimate. Line of Sight Profile Viewshed
Original Vision: Google Earth • Initial vision was to create a distributable tool in Google Earth • Google added a Viewshed tool right after capstone submission • GE capabilities are limited • Viewshed tool is only in Pro Version • No way to raise far endpoint height or modify radius • No way to export viewshed polygon for geoprocessing
Alternative Option: ArcGIS • ArcGIS allows for the following: • Easy tool creation • Polygon creation of viewshed (convert from raster) • Adjustable viewshed parameters • OFFESTA (Height of user holding their radio) • OFFSETB (Height of antenna on a potential antenna site) • RADIUS2 (Radius for area of evaluation) • Requires a DEM • Downloaded test section from USGS (1 Arc-Second) • Sent HDDs to USGS for entire DEM of North America
Viewshed Comparisons GE Pro Viewshed Tool (Various elevation data) ArcMap Viewshed Tool (1 arc-second USGS DEM)
Explanation of the situation Proposed solution Available Datasets of Existing Sites Viewshed analysis
Existing Antenna Site Information • Federal Communications Commission (FCC) • Multiple databases containing lots on information: • Existing towers (public and private) • Currently licensed transmitters • Existing structure types • Coordinates and structure heights • These databases are downloadable as .DAT files with many unique, cryptic tables 79 Different .DAT Table Definitions
Dataset Importation • Store different FCC databases in a MySQL database on my local machine • Develop a front-end in MS Access • Use this to populate MySQL database • Write queries in Access that the tool will use • Create PHP scripts that append the database with updates RESULT: Locally stored database of existing towers and licensed transmitters in United States
Querying the database • Create a tool in Python that performs the Viewshed analysis • Use the results of the viewshed to query the database to return a set of candidate antenna sites • Python library (MySQLdb) to retrieve towers, restricted by distance • Make XY Event Layer • Select Layer by Location RESULT: A set of existing antenna sites that has Line Of Sight to the input location Included Candidate Site Excluded Candidate Site
Explanation of the situation Proposed solution Querying existing datasets Viewshed analysis Creating useful outputs
Tool Outputs in ArcGIS • Viewshed polygon (after raster conversion) • Candidates from existing antenna sites • Organized by Type • Export options • XLS • CSV (for coverage prediction software) • KML
Potential Option: New Site Analysis • PROBLEM: No existing towers are good candidates • OPTION 1: Segment the viewshed as a grid of potential locations for a new site • Fishnet tool • Evaluate based on slope • OPTION 2: Import viewshed into GE Pro • US Parcel Data Layer • Not exportable from GE • Tabular data available from DataQuick • Additional parcel data may be researched 90 meter grids over viewshed GE Pro parcel information
Explanation of the situation Proposed solution Querying existing datasets Viewshed analysis Creating useful outputs Establishing database connections
Transition from Local to Online • Initial version of tool is local • MySQL database on local machine • Online tool will provide connectivity to a public server • The Python-scripted tool will ask the user for a server address • ArcGIS for Server • Server at work • AWS • May require VPN access (TBD)
Timeline • July 2013 • Obtain initial versions of FCC databases and USGS DEM (complete) • Apply for slots in industry conferences (complete) • August 2013 • Set up MySQL DB • Develop local tool using Python • September 2013 • Fine tune tool, ensure viewshed querying works and optionally, new site analysis function • Bring it online • October 2013 • Final report • Prepare industry conference presentation • November 2013 • Present at industry conference • Atlantic APCO • Texas GIS Forum • AGL Conference • Esri Mid-Atlantic UG
Additional Considerations • Additional databases of commercial towers • ATC/Crown • Completely open source • GeoServer/QGIS • New site analysis • Use of tool through ArcGIS Online (perhaps through a freely-accessible WMS)
Acknowledgements • Jim Detwiler • Doug Miller • Beth King