Download
1 / 31
360 likes | 817 Views
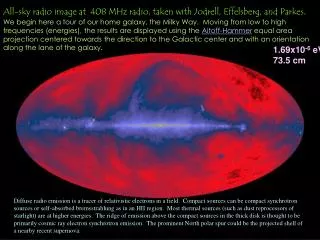
We begin here a tour of our home galaxy, the Milky Way. Moving from low to high frequencies (energies), the results are displayed using the Aitoff-Hammer equal area projection centered towards the direction to the Galactic center and with an orientation along the lane of the galaxy .

E N D
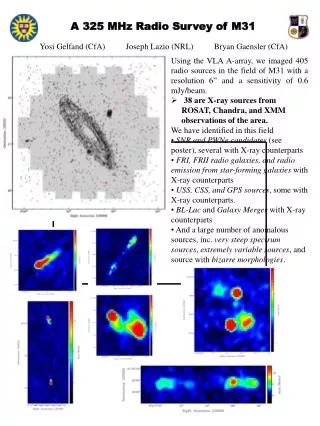
We begin here a tour of our home galaxy, the Milky Way. Moving from low to high frequencies (energies), the results are displayed using the Aitoff-Hammer equal area projection centered towards the direction to the Galactic center and with an orientation along the lane of the galaxy. All-sky radio image at 408 MHz radio, taken with Jodrell, Effelsberg, and Parkes. 1.69x10⁻⁶ eV, 73.5 cm Diffuse radio emission is a tracer of relativistic electrons in a field. Compact sources can be compact synchrotron sources or self-absorbed bremsstrahlung as in an HII region. Most thermal sources (such as dust reprocessors of starlight) are at higher energies. The ridge of emission above the compact sources in the thick disk is thought to be primarily cosmic ray electron synchrotron emission. The prominent North polar spur could be the projected shell of a nearby recent supernova.
5.18x10⁻³ eV 1250 GHz All-sky; COBE DIRBE, 240 mm false-color intensity maps The fluffy dust and smoke of the galaxy show up here in this portrait of the Milky Way. Micron- and submicron-sized particles heat up and reradiate. Infrared intensity is also a good tracer of dense concentrations of matter such as sites of star formation and core collapse supernovae, and OB (hot) star associations. The zodiacal light begins to make its appearance (see Great Discovery Poster by Dwek (GDcobe).
0.36 eV 8.6x10¹³ Hz All-sky; COBE DIRBE intensity map at 3.5 mm The zodiacal light in all its glory. This is the Sun’s thermal emission reprocessed by the dust remaining from the formation of the Solar system. (Note that this map could be symetrically cast as an Aitoff projection in Solar system coordinates. The Milky Way shows up as a dusty ridge of emission with a slight east/west asymmetry and some enhancement in the anticenter direction (see GDcobe).
2.5 eV 6.0x10¹⁴ Hz 5x10⁻⁵ cm All-sky, optical, Lund Obseratory. 5000 A all-sky image. This is not mainly diffuse optical, but rather the integrated starlight from the disk of the Milky Way. The stellar disk has typically a FWHM thickness of ~160 pc, compared with the 8.5 kpc distance to the center of our Galaxy. Strong mottling of the stellar radiation is due to clouds of absorbing dust, which redden the direct emission from the stars. This is the waveband to which many Earth-based phylum are sensitive, probably due to the transparency of water and air at these frequencies.
2-10 keV 0.5-2.5x10¹⁸ Hz 6.2-1.2 A All-sky X-ray intensity map from the A2 experiment on HEAO-1. 2-10 keV X-ray all-sky image. Diffuse and point sources of X-rays from all-sky map made from roughly six months of scanning data. Note the ridge and central bulge of sources, in addition to some high latitude outliers. The implication is that these are mainly galactic sources, and indeed some prevalent source population in the disk consist of accreting high-mass X-ray binaries, low mass X-ray binaries and millisecond pulsars, black-hole candidate systems (see GDbh by Grove and Grindlay, GDns by Finger et al.). Only the faintest sources give evidence for being isotropically distributed and hence perhaps extragalactic; in fact, identifications of X-rays from AGN are common (see GDagn by Weaver).
Electron-positron annihilation radiation 511 keV 1.2x10²⁰ Hz All-sky, 0.511 MeV, OSSE on CGRO overlaid on optical. 511 keV line radiation showing activity at the center of our galaxy. Reanalyses continue to support this discovery image, overlaid on the optical galaxy projection, of a bridge of electron-positron annihilation emission projected above the direction to the center of the Galaxy. An epsiode of starburst activity driving a hot wind into the Galaxy’s halo is one possibility; the asymmetry stems from a preferential venting. Nuclear activity is also possible, not to mention chance foreground effects. An X-ray nova, Rho Ophiuchus 1977, is along the line-of-sight to the high-latitude emission component. The integrated 0.511 MeV radiation from the entire Galaxy is ~ 1 photon every hour or so per square centimeter.
Compton Telescope (COMPTEL) on CGRO All-sky COMPTEL image of 1.809 MeV from the decay of 26Al Galactic longitude l (0o-360o) and latitude b(-90o - 90o) Galactic center (l,b = 0o,0o), Galactic anticenter (l,b = 0o, 180o) 1.809 MeV g rays are a good tracer of recent stellar nucleosynthesis from 26Al (~106 half-life) made in novae and SNe of massive stars. Note the strong clumping toward the galactic disk and the clumping associated with the central regrion, the Cygnus (l ~75o) and Vela (l ~270o) regions.
EGRET spark chamber experiment on CGRO (~100 MeV-5 Gpc) All-sky > 100 MeV gamma rays from EGRET: initial (~18 months) full-sky survey. >100 MeV g-ray all-sky image. Diffuse g rays are largely due to secondary pion decay from cosmic ray proton interactions with gas and dust, and nonthermal CR electron free-free and Compton emissions off diffuse galactic fields. Some high latitude point sources associated with blazars (3C 279 at top, right) and unidentified sources are evident. Young isolated rotation-powered pulsars (see GDpsr by Strickman and Harding) such as Vela (l = 270o), Crab and Geminga (l=190o) are powerful gamma-ray sources. The spiral structure of our galaxy is traced out in diffuse galactic >100 MeV emission; we’re viewing down the Orion (l=~200o, b=~ -25o) arm as can be seen.
EGRET spark chamber experiment on CGRO (~100 MeV-5 Gpc) All-sky > 100 MeV gamma rays from EGRET: analysis of ~6 years of data The importance of long observing and integration times in gamma-ray astronomy is evident in this figure, again showing >100 MeV g-rays. Detailed structure -- or is it statistics? -- is now beginning to become visible away from the plane of the galaxy. The gradient away from the Galactic ridge is a convolution of relativistic particle intensities, and the intensity and directional properties of the magnetic and radiation fields. Sorting out the right particle and field intensities provide a global picture of the particle and current flows that, with gravity, regulate the workings of the Milky Way and, by implication, other (spiral) galaxies.
Multiwavelength mural. For more information, visit the backdrop. Credit: D. Leisawitz and J. Friedlander.
ASCA image: 2-10 keV X-ray emission from the SNR of SN 1006. SNR 1006,at 1.7-3 kpc, was formed when a star with mass ~10-20 Mo exploded. The bright remnant ridge emission, coupled with the oddly weak or absent X-ray line signature from bound-bound and bound-free processes, suggests that the emission is probably synchrotron from TeV electrons accelerated at a shock front. Asymmetry in the shock emission has to do with global magnetic field geometry and surrounding medium structure. Much theoretical work argues that supervova shock fronts are efficient sites of nonthermal electron acceleration through the mechanism of diffusive (Fermi type-1) shock acceleration. This does not prove the cosmic ray acceleration hypothesis because surrounding nonthermal electrons could be compressively heated and enhanced (see GDcr by Lingenfelter).
ROSAT PSPC (1.7-3.1 keV) Vela and Puppis A SNRs in X-rays Vela and Puppis A SNRs. The larger roughly circular Vela, at ~0.5 kpc, covers most of the field. Puppis A, at ~2 kpc, is the bright enhancement at upper right. Vela is ~104 years old and has a diameter of ~75 pc. Many of X-ray SNRs have rich line structure in the 0.1 - several keV from collision electron excitation of the highly enriched (from the supernova) material. Though invoked for simplicity, the assumption of local thermodynamic equilibrium often proves to be wrong.
ROSAT HRI (~0.5-2 keV) SNR Puppis A in X-rays with Rosat This supernova remnant brings up the subject of pulsar/SNR associations. Though not shown here, Puppis A has a convincing pulsar association. Perhaps 10% of Sne do. Is the beaming factor 10%, or do SNe collapse into other forms, such as quark stars, strange stars, or black holes.
Eagle Nebula (Detail) showing settling and gravitational sedimentation of gaseous matter in the gravitational field of our Galaxy. Gravitational collapse leading to star formation will result if photo-erosion does not disperse it first .
Eta Carina with HST WFPC2 Eta Carinae at 2.6 kpc, shows dust lanes, tiny condensations, and strange radial streaks from an analysis of HST WFPC2 data using a combination of image processing techniques such as dithering, subsampling and deconvolution. Images taken through red and near-ultraviolet filters were subsequently combined to produce the color image shown. A sequence of eight exposures was necessary to cover the object's huge dynamic range: the outer ejecta blobs are 100,000 times fainter than the brilliant central star. Eta Carinae was the site of a giant outburst about 150 years ago, when it became one of the brightest stars in the southern sky. Though the star released as much visible light as a supernova explosion, it survived the outburst. Somehow, the explosion produced two polar lobes and a large thin equatorial disk. The new observation shows that excess violet light escapes along the equatorial plane between the bipolar lobes. Apparently there is relatively little dusty debris between the lobes down by the star; most of the blue light is able to escape. The lobes, on the other hand, contain large amounts of dust which preferentially absorb blue light, causing the lobes to appear reddish. Estimated to be 100 times more massive than our Sun, Eta Carinae may be one of the most massive stars in our Galaxy. It radiates about five million times more power than our Sun. This star's outburst may provide unique clues to other, more modest stellar bipolar explosions and to hydrodynamic flows from stars in general.
HST WFPC2 Hourglass (MyCn18) Nebula Hourglass nebula,MyCn18, a young planetary nebula ~2.6 kpc away. This picture has been composed from three separate images taken in the light of ionized nitrogen (represented by red), hydrogen (green), and doubly-ionized oxygen (blue). Ejection of stellar matter which accompanies the slow death of Sun-like stars is studied. According to one theory for the formation of planetary nebulae, the hourglass shape is produced by the expansion of a fast stellar wind within a slowly expanding cloud which is more dense near its equator than near its poles. What appears as a bright elliptical ring in the center, and at first sight might be mistaken for an equatorially dense region, is seen on closer inspection to be a potato shaped structure with a symmetry axis dramatically different from that of the larger hourglass. The hot star which has been thought to eject and illuminate the nebula, and therefore expected to lie at its center of symmetry, is clearly off center.
Southern Ring Nebula with HST This photo reveals elongated dark clumps of material embedded in the gas at the edge of the nebula; the dying central star floating in a blue haze of hot gas. The nebula is about a light-year in diameter and is located some 2,000 light-years from Earth in the direction of the constellation Lyra. The colors are approximately true colors. The color image was assembled from three black-and-white photos taken through different color filters with the Hubble telescope's Wide Field Planetary Camera 2. Blue isolates emission from very hot helium, which is located primarily close to the hot central star. Green represents ionized oxygen, which is located farther from the star. Red shows ionized nitrogen, which is radiated from the coolest gas, located farthest from the star. The gradations of color illustrate how the gas glows because it is bathed in ultraviolet radiation from the remnant central star, whose surface temperature is a white-hot 216,000 degrees Fahrenheit (120,000 degrees Celsius).
Lagoon Nebula The Lagoon Nebula (Messier 8) which lies 1.7 kpc away in the direction of the constellation Sagittarius. The central hot star, O Herschel 36 (lower right), is the primary source of the ionizing radiation for the brightest region in the nebula, called the Hourglass. Other hot stars, also present in the nebula, are ionizing the extended optical nebulosity. The ionizing radiation induces photo-evaporation of the surfaces of the clouds and drives away violent stellar winds tearing into the cool clouds. The Lagoon Nebula and nebulae in other galaxies are sites where new stars are being born from dusty molecular clouds. HST WFPC2 images through three narrow-band filters (red light - ionized sulphur atoms, blue light - double ionized oxygen atoms, green light - ionized hydrogen).
Ring Nebula, HST which is located primarily close to the hot central star. Green represents ionized O, which is located farther from the star. Red shows ionized N, which is radiated from the coolest gas, located farthest from the star. The gradations of color illustrate how the gas glows because it is bathed in UV radiation from the remnant central star, with surface temperature 1.2x10⁵ K). HST WFPC2 700 pc M57.Note elongated dark clumps of material embedded in the gas at the edge of the nebula; the dying central star floating in a blue haze of hot gas. The colors are approximately true colors. Blue isolates emission from very hot He,
Orion Nebula with HST At 1500 lt-years (500 parsecs), Orion is one of the closest sites recent star formation (300,000 years ago). The nebula is a giant gas cloud illuminated by bright young stars. Many of the fainter young stars are surrounded by disks of dust and gas that are slightly more than twice the diameter of the Solar System. Red light depicts emission in Nitrogen; green is Hydrogen; and blue is Oxygen. elongated dark clumps of material embedded in the gas at the edge of the nebula; the dying central star floating in a blue haze of hot gas. The colors are approximately true colors. Blue isolates emission from very hot He,
Orion Proplyds with HST These are possibly protoplanetary disks, or "proplyds," that might evolve on to agglomerate planets. The proplyds which are closest to the hottest stars of the parent star cluster are seen as bright objects, while the object farthest from the hottest stars is seen as a dark object. The field of view is only 0.14 light-years across.
Crab Nebula M1, the Crab nebula, is justly famous for: historical supernova, plerionic (filled-center) supernova remnant, 33 ms young neutron star with inferred polar surface magnetic field of > 1012 Gauss, nonthermal optical, X-ray, soft to hard (> 100 MeV) pulsed and steady gamma rays, TeV emission, and the structure shown here, to name a few. @Anglo-Australian Observatory credit: David Malin
Polarization map of the Crab Nebula Polarization map, Keck image, demonstrating a nonthermal synchrotron origin of the emission. The burned-out pixels mark the Crab pulsar.
Vela SNR nebula About 120 centuries ago an inconspicuous star in the constellation of Vela brightened by about 100 million times to rival the Moon as the brightest object in the night sky. This photograph shows a portion of the north-western quadrant of an expanding nebulous shell, which now surrounds the site of the explosion. Near the centre of the nebula (and not seen here) is the Vela pulsar, a rapidly-spinning neutron star only a few kilometres in diameter, the remnant of the star that exploded. This tiny object spins about 11 times a second and is among the faintest stars ever studied at optical wavelengths, a far cry from its brief glory as one of the brightest stars ever seen. @Anglo-Australian Observatory credit: David Malin
47 Tuc Among the many spectacular objects in the southern skies are two magnificent naked-eye globular clusters, omega Centauri and 47 Tucanae. These ancient cities of stars are captives of the Milky Way but were formed long before our Galaxy assumed its present shape, indeed these clusters have some of the oldest known stars. 47 Tuc is about 15,000 light years distant and contains several million stars, as many as some minor galaxies. The crowded central region leads to occasional stellar encounters and it is in 47 Tuc that rapidly-spinning pulsars have recently been discovered by radio astronomers. Though the light of globular clusters is dominated by so-called 'red' giant stars, their colour is no redder than a domestic tungsten lamp, so the true colour of 47 Tuc is close to the pale yellow reproduced here. @Anglo-Australian Observatory credit: David Malin
Antares and Rho Ophiuchus molecular cloud complexes The dusty region between Ophiuchus and Scorpius contains some of the most colourful and spectacular nebulae ever photographed. The upper part of the picture is filled with the bluish glow of reflected light from hot stars near a huge, cool cloud of dust and gas where stars are born. Dominating the lower half of the picture is the over-exposed image of the red supergiant star Antares, a star that it is steadily shedding material from its distended surface as it nears the end of its life. These solid particles reflect Antares' light and hide it in a nebula of its own making. Finally, partly surrounding Sigma Scorpii at the left of the picture is a red emission nebula, completing the most comprehensive collection of nebular types ever seen in one photograph. @Anglo-Australian Observatory credit: David Malin
Trifid Nebula Vast clouds of hydrogen mixed with tiny dust grains are distributed throughout the Milky Way. The hydrogen can only be seen at visible wavelengths when it is illuminated by very hot stars. The light from these stars is sufficiently rich in ultraviolet light to cause the gas to glow with its characteristic red colour. In most cases, such as here, the hot stars formed recently from the hydrogen cloud. The stars found at the heart of the Trifid Nebula are here seen associated with dust lanes which are silhouetted against the glowing background. This nebula is in the constellation of Sagittarius at a distance of about 3000 light years. @Anglo-Australian Observatory credit: David Malin
Around Eta Carina This wonderfully complex region at the heart of the NGC 3372 nebula was first described in detail by Sir John Herschel in 1838. He saw the bright circular shell visible in the upper part of the picture extending to the south to form a keyhole-shaped nebula. This luminous outline is no longer seen and the southern extension appears only as a dark dust cloud. It seems that the curious, explosively variable star Eta Carinae (in the tiny orange nebula to the left of the dust cloud) has enveloped itself in a cocoon of obscuring matter in the years since Herschel's observations and light from the star is no longer able to illuminate the rim of the dust cloud. @Anglo-Australian Observatory credit: David Malin
This completes our brief tour of the Milky Way; in 3 frames you return to main menu. Milky Way (Detail) This wide-angle picture, covering over 50 degrees of the southern Milky Way, was made using color film in a conventional camera, which was pointed towards the centre of our Galaxy. The Galactic center itself is totally obscured at visible wavelengths by the band of dust which divides the Milky Way along much of its span. Against this dark lane can be seen many bright red emission nebulae. The brightest, near the center of the picture, is Messier 8, the Lagoon Nebula, which is visible to the unaided eye. At least 16 other prominent objects catalogued by Messier can be found on the photograph. @Anglo-Australian Observatory credit: David Malin
HR Diagram shows the dependence of stellar surface temperature (abscissa) as a function of luminosity (ordinate). Oftentimes the B-V colors are substituted for temperature, and the bolometric magnitude -- or luminosity -- has large uncertainties due to reddening. An accurate distance scale is essential to construct an HR diagram, so that HR diagrams of localized star clusters are most reliable. The solutions to the equations of stellar structure can explain, though not without assumptions about convective mixing, the HR diagram . Hertzsprung-Russell Diagram @ Cambridge University Press
Aitoff-Hammer equal area projections as shown for the Earth; note the freedom of choosing projection center direction