Download
1 / 59
590 likes | 746 Views
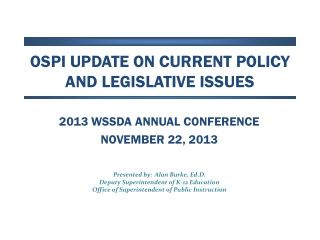
OSPI Update on Current Policy and Legislative Issues. 2013 WSSDA Annual Conference November 22, 2013. Presented by: Alan Burke, Ed.D . Deputy Superintendent of K-12 Education Office of Superintendent of Public Instruction.

E N D
OSPI Update on Current Policy and Legislative Issues 2013 WSSDA Annual Conference November 22, 2013 Presented by: Alan Burke, Ed.D. Deputy Superintendent of K-12 Education Office of Superintendent of Public Instruction
Elementary and Secondary Education Act (ESEA)Flexibility WAIVER OVERVIEW • ESEA original authorization in 1965 • Lyndon Johnson / Great Society • A Nation at Risk (1983) • George HW Bush / America 2000 • Bill Clinton / Goals 2000 • Reauthorization every 5 years, but… • 2002 Reauthorization = NCLB • 2007 Reauthorization still has not occurred • 2012 U.S. Dept of Ed established waiver program 2
Where we were beginning in 2002ELEMENTARY SCHOOL STATE UNIFORM BAR 3
School Continue: Continue: Continue: Improvement Public School Public School Public School Plan Choice Choice Choice Supplemental Supplemental Services Plan for Supplemental Corrective Public School AlternativeGovernance Services Action Choice AYP TIMELINE FOR SCHOOLS (Consequences apply only to schools receiving Title I funds) Sanctions are a District Responsibility Implement Plan For AYP AYP Alternative Governance WASL Results WASL Results 1 2 AYP AYP AYP AYP AYP 1 2 3 4 5 Step Step Step Step Step Identified for School Improvement 6
FLEXIBILITY TO IMPROVE STUDENT ACHIEVEMENT AND INCREASE THE QUALITY OF INSTRUCTION Implementation of School Improvement Requirements • Flexibility from requirement for school districts to identify or take improvement actions for schools identified for improvement, corrective action, or restructuring • Eliminates Public School Choice (PSC) as a mandate • Eliminates Supplemental Educational Services (SES) as a mandate • Eliminates the 20% district Title I set aside to fund PSC and SES • Eliminates the 10% set aside for professional development for schools 7
What does EseaFLEXIBILITY require from states? • Ensure college- and career-ready expectations for all students in Washington • Common Core State Standards (CCSS) and Smarter Balanced Assessment Consortium (SBAC) • Implement state-developed system of differentiated recognition, accountability, and support • Support effective instruction and leadership in Washington— Teacher and Principal Evaluation Project (TPEP) • Reduce duplication and unnecessary burden on school districts by the state 8
PRINCIPLE 1: COLLEGE- AND CAREER-READY EXPECTATIONS FOR ALL STUDENTSTo support States in continuing the work of transitioning students, teachers, and schools to higher standards • Adopt college- and career-ready (CCR) standards in at least reading/language arts and mathematics • Transition to and implement CCR standards • Develop and administer Statewide, aligned, high-quality assessments that measure student growth • Adopt English Language Proficiency (ELP) standards corresponding to the State’s new CCR standards and develop aligned assessments 9
PRINCIPLE 2: STATE-DEVELOPED DIFFERENTIATED RECOGNITION, ACCOUNTABILITY, AND SUPPORTTo support states’ efforts to move forward with next-generation accountability systems • Set ambitious but achievable Annual Measurable Objectives (AMOs) • Reward schools: Provide incentives and recognition for high-progress and highest performing Title I schools • Priority schools: Identify lowest performing schools and implement interventions aligned with the turnaroundprinciples • Focus schools: Close achievement gaps by identifying and implementing interventions in schools with the greatest achievement gaps or low graduation rates • Provide incentives and supports for other Title I schools (Emerging Schools) • Build State Education Agency (SEA), Local Education Agency (LEA), and school capacity to improve student learning in all schools 10
STATES MUST: • Set ambitious, but achievable, Annual Measurable Objectives (AMOs) • Identify: • Reward schools: Provide incentives and recognition for high-progress and highest performing Title I schools • Priority schools: Identify lowest performing schools and implement interventions aligned with the turnaroundprinciples • Focus schools: Identify and implement meaningful interventions (e.g., turnaround principles) in schools with the lowest performing subgroups • Other low-performing Title I schools (Emerging schools): Provide incentives and support • Build state, district, and school capacity 11
Accountability System Based on ESEA REQUEST Up to 2011-12 2012-13 and 2013-14 2014-15 and beyond • AMO Calculations • Annual targets intended to close proficiency gaps by half by 2017; uses 2011 as baseline and adds equal annual increments (1/6 of proficiency gap) to get to 2017 target; each subgroup, school, district, and state have unique annual targets. • Calculations reported on Report Card • No AYP sanctions based on identification of schools and districts “in improvement” • Requires districts to set aside up to 20% for Priority, Focus, and Emerging Schools • AYP Determinations • Sanctions for schools and districts “in improvement” • Set-asides required for Public School Choice and Supplemental Education Services • School Improvement • Uses AYP calculations to identify schools and districts in a step of improvement (Title I) • Uses PLA Methodology based on AYP calculations to generate list of Persistently Lowest Achieving Schools (PLAs) Washington State’s New Accountability System Used to identify Reward, Priority, Focus, and Emerging schools for Title I and non-Title I schools ESEA Request Accountability System Used to identify Reward, Priority, Focus, and Emerging schools SBE/OSPI Achievement Index Used to identify Award Schools 12
OPTION A: SET AMBITIOUS BUT ACHIEVABLE ANNUAL MEASURABLE OBJECTIVES (AMOs)NEW AMOs (Targets): Cut Proficiency Gap by Half by 2017Sample High School - 10th Grade ReadingOur goal for all Students remains 100% meeting standard! Decrease of 50% Proficiency Gap 13
How is a school identified? Priority: Based on “All Students” Performance Thresholds:Priority: <38.1%Emerging-P: <42.3% Focus: <13.5%Emerging-F: <19.8% Focus: Based on “Subgroup” Performance Next 10% (Emerging = Other Title I Schools) Next 5% EmergingFocus (Next 10%) EmergingPriority (Next 5%) Priority (lowest 5%) Focus (lowest 10% ) 14
Proposed State and Federal Accountability System State System Federal Definitions Priority: Lowest 5% based on Index + High Schools w/Grad Rates < 60% Reward – Highest Performing Reward – High-Progress “Emerging”: Next 5% based on Index Focus: Subgroup Performance – Lowest 10% on Assessments + Grad Rates < 60% 15
PRINCIPLE 3: SUPPORTING EFFECTIVE INSTRUCTION AND LEADERSHIP To support SEA and LEA development of evaluation systems that go beyond NCLB’s minimum HQT standards • Develop and adopt SEA guidelines for local teacher and principal evaluation and support systems • Ensure LEAs implement teacher and principal evaluation and support systems that are consistent with SEA guidelines 16
Upshot: State-based tools have limited applicability. Only teachers in Grades 4–8 with ELA or math courses can use summative testing as part of their evaluation.(HS math teachers with students in 9th grade Algebra or 10th grade Geometry could be included) Since evaluations are due in early May and SGP ratings aren’t available until Sept. 1, analysis will always be one year behind. Teacher attribution is challenging at all levels: Middle school students are reported by individual classes in CEDARS Elementary school students are reported by homeroom teacher in CEDARS Transition to a new set of standards and a new exam system will take time. Use of Student Growth DataUsing State-Based Tools 18
Student Growth Percentiles Where We Are • March 2013: SGPs from 2011 & 2012 have been provided to districts for Grades 4–8 and high school (reading and math MSP, HSPE, and EOC)* • October 2013: SGPs from 2013 provided to districts • October 2014: ? • October 2015: SGPs from 2015 (Smarter Balanced) provided to districts • October 2016: SGPs from 2016 (Smarter Balanced) provided to districts (could use in 2016–17 evaluations) *High school SGPs will be available for consecutive year tests (e.g., 8th MSP, 9th Algebra 1, 10th Geometry) 19
Example from a district in a state with a 50% student growth rule 20
An SEA is responsible for ensuring that an LEA develops and implements evaluation and support systems consistent with the guidelines the SEA has developed under principle 3 (as described in the document titled ESEA Flexibility). This includes ensuring that LEA evaluation and support systems take into account data on student growth in significant part in determining teacher and principal performance levels…. For grades and subjects in which assessments are required under ESEA section 1111(b)(3), an SEA must define a statewide approach for measuring student growth based on such assessments. Student growth data that is relevant to the teacher and subject matter must be a factor in the evaluation process and must be based on multiple measures that can include classroom-based, school-based, district-based, and state-based tools. Student growth means the change in student achievement between two points in time. federal state E2SSB 6696 contains language around student growth including: ESEA Flexibility -- Frequently Asked Questions (C-53): What are an SEA’s responsibilities with regard to ensuring that an LEA’s evaluation and support systems consider student growth? 22
USED requires state test scores in tested grades and subjects to be a significant part of teacher evaluation Waiver requires change from “can be used” to “must be used” regarding state tests Supt. Dorn will seek request legislation to change ESSB 5895 language from canto must. It will also include a statement that will delay the implementation of using state test scores in teacher evaluations to 2016-17 Smarter Balanced assessment system will have an effect on timeline for implementation Waiver decision expected May 2014 20% of Title 1 funds return to mandated use without a waiver: $44M total available to Supplemental Educational Service (SES) providers and to support School Choice $18M used three years ago $2.6M in Seattle PRINCIPLE 3: ESEA Waiver 23
For more information: • ESEA Flexibility Web Site • www.ed.gov/esea/flexibility • Questions? • ESEAflexibility@ed.gov 24
First change educator evaluation since the 70s New criteria for teachers and for principals Emphasis on instructional improvement for all educators Established Steering Committee with designated functions Gave OSPI rule-making authority E2SSB 6696 (2010) ESSB 5895 (2012) • Implementation timelines • Instructional Framework details • Role of the pilots • Reports to the Legislature 27
Transition / Implementation(Suggested Timeline) * In order to go on the focused a certificated classroom teacher must have 4 years of satisfactory evaluation (RCW 28A.405.100). 31
Evidence Evaluation Summative Scoring Process Criterion Rating Summative Rating Standards Observation Artifacts Other evidence relevant to the frameworks District determined process Distinguished Proficient Basic Unsatisfactory Criteria 1 State determined process Distinguished Proficient Basic Unsatisfactory Criteria 2 Criteria 3 Frameworks + Student Growth Rubrics Criteria 4 Criteria 5 Criteria 6 Criteria 7 Criteria 8 32
The RAW Score Model • Evaluators place teachers into preliminary summative rating categories based on score bands. As illustrated above, this teacher would receive a preliminary overall summative rating of Proficient. 33
Five Student Growth Criteria 3.1 Establish Student Growth Goals Re: individual or subgroups of students (achievement/ opportunity gap) 3.2 Achievement of Student Growth Goals Re: individual or subgroups of students (achievement/ opportunity gap) 6.1 Establish Student Growth Goals using Multiple Student Data Elements Re: whole class based on grade-level standards and aligned to school and district goals 6.2 Achievement of Student Growth Goals Re: whole class based on grade-level standards and aligned to school and district goals 8.1 Establish Team Student Growth Goals Re: Teacher as part of a grade-level, content area, or other school/district team Using District, School, and Classroom-based Data (Teachers) 37
Student Growth Rubric and Rating(Teachers Only) • Evaluators place teachers into summative rating categories based on score bands. As illustrated above, this teacher would receive a low student growth rating. • * Must include a minimum of two student growth measures (e.g., state-, district-, school-, and classroom-based measures). • **A student growth score of 1 in any of the student growth rubrics will result in a Low growth rating. • ***For teachers on a focused evaluation, any cell with a score of 1 will result in a low rating; a rating above 1 in all cells will result in an adequate rate. 38
Within two months of receiving the low student growth score or at the beginning of the following school year, whichever is later, one or more of the following must be initiated by the evaluator: Triangulate student growth measure with other evidence (including observation, artifacts and student evidence) and additional levels of student growth based on classroom, school, district and state-based tools; Examine extenuating circumstances possibly including: goal setting process/expectations, student attendance, and curriculum/assessment alignment; Schedule monthly conferences with the teacher to discuss/revise goals, progress toward meeting goals, and best practices; and/or Create and implement a professional development plan to address student growth areas. Student Growth Inquiry Consequences 39
Summative Assessments for Accountability • Coverage of full breadth/depth of Common Core • Computer Adaptive Testing (CAT) • Precise assessment of all students • More engaging assessment experience • Performance Tasks – real world problems Formative Tools and Resources for Improved Instruction • Digital library gives access to high-quality resources • Tools/materials for classroom-based assessments • Professional social networking (Web-based PLCs) • Useful for in-service and pre-service development ✔ Balanced Assessment Interim Assessments to Signal Improvement • Optional for district, school or classroom use • Fully aligned with Common Core – same item pool • Focus on set of standards or clone summative test • Teachers can review and score responses ✔ ✔
A Balanced Assessment System English Language Arts/Literacy and Mathematics, Grades 3-8 and High School School Year Last 12 weeks of the year* DIGITAL CLEARINGHOUSE OF FORMATIVE TOOLS, PROCESSES AND EXEMPLARS Released items and tasks; Model curriculum units; Educator training; Professional development tools and resources; Scorer training modules; Teacher collaboration tools; Evaluation of publishers’ assessments. Optional Interim Assessment Optional Interim Assessment • PERFORMANCE TASKS • ELA/Literacy • Mathematics • COMPUTER ADAPTIVE TESTS • ELA/Literacy • Mathematics Computer Adaptive Assessment and Performance Tasks Computer Adaptive Assessment and Performance Tasks Re-take option Scope, sequence, number and timing of interim assessments locally determined *Time windows may be adjusted based on results from the research agenda and final implementation decisions.
Major Milestones in Development of Summative Assessments ✔ ✔ ✔ Full system run-through; Establish performance standards Early Q.C. of items & software; no student results
Technology Requirements: Responding to School Needs • Smarter states have established standards for new and existing hardware • Online “Readiness Tool” • Schools and districts can evaluate technology readiness • Schools do NOT need one-to-one computers • Illustrative example: A 600-student school can be supported by a single 30-computer lab • Smarter Balanced Readiness Calculator at: http://www3.cde.ca.gov/sbactechcalc/ • Pencil-and-paper option available for three-year transition period
Accommodations The Usability, Accessibility, and Accommodations Guidelines are available at http://www.smarterbalanced.org/wordpress/wp-content/uploads/2013/09/SmarterBalanced_Guidelines_091113.pdf
Learn More and Stay Engagedwww.smarterbalanced.org • Visit us at: SmarterBalanced.org • Sign up for the e-newsletter • Follow on Twitter: @SmarterBalanced
Evolution to Smarter Balanced Summative Assessments in Washington 47
With Summative High School Assessments in 2014–15 and beyond 48
HS Testing for Graduation (new June 30) Graduation Assessment Requirements • Classes of 2013 and 2014 • HSPE Reading, HSPE Writing; 1 EOC Math • Classes of 2015 – 2018 • ELA exit exam; 1 EOC Math exit exam; EOC Biology • Smarter Balanced ELA and math tests taken in 11th for school accountability • Class of 2019 and beyond • Smarter Balanced tests in ELA and Math; Biology or NGSS 49
Smarter Balanced Field Testing • US Dept of Ed is allowing states to participate in the Smarter Balanced field test in 2013-14 (pending ESEA Waiver approval): • Washington has opted for the blended model (grades 3-8 only) where some schools take current tests and some schools take field tests • If only giving field tests, school accountability is carried over from 2013 MSP • Waiver will be submitted at end of November– approval likely in December • High schools need to administer all current state tests due to graduation requirements 50