Download
1 / 1
10 likes | 104 Views
Investigating the Two Higgs Doublet Model's implications on Flavor Changing Neutral Currents, deriving the partial width of (t→H⁺b), analyzing limits on new parameters, and comparing with experimental data.

E N D
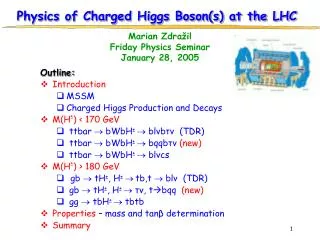
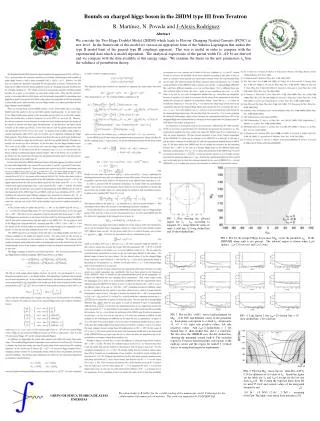
Bounds on charged higgs boson in the 2HDM type III from Tevatron R. Martínez, N. Poveda and J-Alexis Rodríguez Abstract We consider the Two Higgs Doublet Model (2HDM) which leads to Flavour Changing Neutral Currents (FCNC) at tree level. In the framework of this model we can use an appropiate form of the Yukawa Lagrangian that makes the type II model limit of the general type III couplings apparent. This way is useful in order to compare with the experimental data which is model dependent. The analytical expressions of the partial width (t→H+ b) are derived and we compare with the data available at this energy range. We examine the limits on the new parameters ij fron the validness of perturbation theory. FIG 1. Plot showing the allowed region for tt - bb according to equation (11), using different values of tan (1 solid line, 0.5 long dashed line and 10 short dashed line). FIG 2. Plot for the charged Higgs boson mass MH± versus the parameter bb . In the 2HDM-III when tan is not present. The allowed region is shown when tt=0 (points), tt=-2.8 (crosses) and tt=2 (stars) FIG 3. Plot for B(t →bH+) versus tan parameter for MH+ =140 GeV and different values of the parameter ii. Each plane corresponds to a fixed tt, downward= ±1, ±2, ± 0.1 right side positive values, left side negatives values. And bb=-2 dashed-line, = -1 dot dashed line =1 short-dashed line, and = 2 solid line. We also show the 2HDM-II case, dot-dot-dashed line, showing the minimum around tan~6. The excluded region by Tevatron (horizontal line) corresponds to the right-up corner and the region for tan<0.3 (vertical line) is an unexplored region by experiments FIG. 4. Like figure 3 but bb=-20 dashed line = 10 short dashed line, = 20 solid line. FIG. 5. Plot fon MH± versus the tan when B(t→bH+)≤ 0.36 for different set of values of ii. Inside the figure are the labels for tt and bb=1 except for the last one wich bb=10. We overlap the expected limits from D0 for mt=175 GeV and several values of the integrated luminosity and (0.1 fb-1 , 1.8 TeV), (2 fb-1 , 2 TeV ) , assuming (tt)=7pb. The limits were taken from reference [11] We acknowledge to R.A Díaz for the careful reading of the manuscript, and J. P Idarraga for his collaboration with numerical calculations. This work was supported by COLCIENCIAS. GRUPO DE FISICA TEORICA DE ALTAS ENERGIAS