Download
1 / 44
450 likes | 644 Views
Color Perception and Meaning in Astronomy. Alan Goldberg / NOVAC VAAS Ann. Mtng. / Crockett Park / Oct. 2013. Introduction. Why can’t I see the bright colors of the best astrophotos ? Why doesn’t my color CCD camera show the bright colors either?

E N D
Color Perception and Meaning in Astronomy Alan Goldberg / NOVAC VAAS Ann. Mtng. / Crockett Park / Oct. 2013
Introduction • Why can’t I see the bright colors of the best astrophotos? • Why doesn’t my color CCD camera show the bright colors either? • Why do things look different on the screen than in a print? • To answer these, we need to consider • what color of a sky object means • how our eyes respond • how different cameras respond • how we show colored images on display screens and on prints • how the best color astrophotos are made, and how they differ from everyday photography • how to convey the most information in a color photo
Major points • there is no single “right” way to create an astrophoto • it needs to be appropriate to convey information or an impression for the intended purpose • natural color is frequently not best way to go • in commercial photography, mostaccurate color is rarely most pleasing color • astrophotography is not general photography • sources are different • purposes are often different • evaluation is different
Telescopes added optical amplification in 1610 Trapezium as sketched by Galileo
Photography added chemical amplification & permanence, 1800s
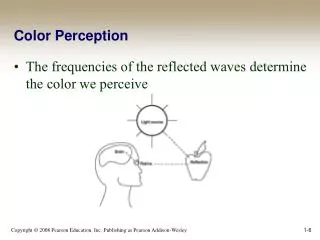
General flow of sensor processing RGB Output Channels Filtered Sensor response Radiometric & Spatial Processing Display Record Visual Response
Spectral display processing options Examples: Colorization Pseudocolor to color True color & False color Target-specific processing; Thematic analysis; Dynamic range compression R G B Convert a brightness into a series of colors with a LUT Convert 2 colors into 3 using “reasonable” interpolation Improve saturation, color separation, gamut use; add brightness from a 4th channel Process multiple channels based on their meaning in the scene; convert the result into continuous or quantized color space R G B R G B R G B
Improving color clarity Astronomiks CLS CCD Hutech Light Pollution Suppression Filters can be used to pass most of the visual or silicon (CCD) spectrum Improves total useful power to eye or camera May improve ability to discriminate colors
Mars:derived true color by mixing Credit: NASA/JPL/Cornell
Going for information content with “false color” combinations
First “false color” was Ektachrome IR Representing NIR-R-G as R-G-B
Landsat extended the concept: False color band combinations 321 432 Natural color and EIR false color were emulated with Landsat bands 1 2 3 4 http://gdsc.nlr.nl/gdsc/information/earth_observation/band_combinations
Landsat extended the concept: False color band combinations 321 432 453 742 543 http://gdsc.nlr.nl/gdsc/information/earth_observation/band_combinations
Narrow band “planetary” filters give 3 colors, but not true color Hydrogen (Ha, red, 656 nm), doubly ionized Oxygen (OIII, green, 501 nm), and neutral Oxygen (OI, blue, 630 nm) George Jacoby, WIYN/NSF Ha 656.3 nm 1.02 um (HeII 10124 A) (red) Ha (blue) [SIII] 9532A (green) Nigel Sharp, Rich Reed, Dave Dryden, Dave Mills, Doug Williams, Charles Corson, Roger Lynds and ArjunDey/NOAO/WIYN/NSF [SII] 672 nm H alpha (red, 656.3 nm), OIII (green, 500.7 nm), OII (blue, 372.7 nm) Michael Pierce, Robert Berrington (Indiana University), Nigel Sharp, Mark Hanna (NOAO)/WIYN/NSF OIII 496&501 nm
Processing colors: different ways for different purposes Hue-Saturation-Value space is frequently used to make appearance more dramatic (more colorful), or to fuse multiple data sources (e.g., albedo & composition) Red-Green-Blue Coordinate System Hue-Saturation-Value Coordinate System
Planet with solid surface Rhea U – G – IR - L Hyperion H2O – ? – CO2
Planets with thin atmosphere Titan 420 (haze) 938 (surface) 889 (CH4)
Planets with thick atmosphere 3.66 (aurora) 3.95 (refl sunlight) 5.02 (thermal) 2.3 (NH3 gas abs) 3.0 (H2O solid abs) 5.1 (thermal)
Nebulae with fluorescence and plasmas Kepler’s SN1604 / Cas A XR - Chandra XR – Chandra VIS - HST IR- Spitzer
Thematic processing to show energy spectrum of a SN: Cas A “Normal” processing R =0.3-1.55 keV Soft G = 1.55-3.34keV Medium B = 3.34-10.0 keV. Hard “Converted to X-ray spectral index Processed to not saturate Robert Lupton, Princeton (2003)
Highly processed • Plenty of light • Physics-based • Raw images collected with polarimetry and very narrow filters • Yields magnetic vector data • Coloration by lookup table (LUT) • Quantized results can be called “Thematic image”
Giving the impression of color… W G B R Bk
from monochrome… W G B R Bk
... Or an empirical evaluation of gas distributions R 8870 NH3 G 8300 B 5600
Thematic imagery of the Moon Sensor data calibrated, mosaicked, and animated Lunar Prospector Gamma Ray Spectrometer Thorium Potassium Clementine FeO 750nm albedo
Can there be too much? Cen A XR, radio, VIS
Wrapup • The first purpose of color should be to communicate understanding honestly. • Along the way, capture attention and give please the visual senses. • Both may benefit from natural color, intensified color, or false color. • Enjoy!
Abstract • Why do colors in astrophotos look so good, while colors in the eyepiece are so muted? The answer to this question leads to an intriguing story of the nature of the sky objects, physics of light, eyeballs, cameras, and computers. This talk will try to explain and show the difference between true color, pleasing color, and informative color when applied to imaging stars, planets, nebulae, and objects beyond. • Biography • Alan Goldberg is a member of NOVAC and a principal scientist with The MITRE Corp. in McLean, VA. He’s been an amateur astronomer since elementary school, and finally owns an 8” SCT. After graduate study at Univ. of Texas and MIT in astronomy and planetary science, he worked on the design and operation of the Hubble Space Telescope. He has also worked on Landsat, NASA’s Earth Observing Satellite (EOS) series, and NOAA’s NPOESS weather satellites. He currently assists the government in buying commercial space-based Earth imagery.
In addition to most sources having subdues colors, the eye has limited color sensitivity at low light levels Rods are… Cones are… Photopic & Scotopic
Resources • Chandra • Composite missions http://www.nasa.gov/images/content/162765main_chandra-casa_516.jpg • Composite missions http://www.nasa.gov/images/content/457213main_n49_bullet_tweak2_665.jpg • Cassini • False color http://www.nasa.gov/images/content/436016main_pia12571-full2.jpg • LUT mapping http://www.nasa.gov/images/content/435598main_pia12867-516.jpg • ACE • LUT mapping http://www.srl.caltech.edu/ACE/Gallery/1sun.tif • Fermi • Composite missions http://www.nasa.gov/images/content/437997main_CenA_radio_optical_gamma_composite_labeled.jpg • Herschel • Composite http://www.nasa.gov/images/content/452762main_A-Herschel20100511-516.jpg • IRAS • False color http://www.ipac.caltech.edu/Outreach/Gallery/IRAS/IRAS_allsky_big.jpg • False color lambda Ori http://www.astro.wisc.edu/~dolan/thesis/lambdaori-iras.gif • Galileo • False color Moon http://upload.wikimedia.org/wikipedia/commons/1/11/Moon_-_False_Color_Mosaic.jpg • Look at: • False color • Thematic mapping • Artistic combinations http://diglloyd.com/articles/Infrared/LeicaM8_infrared-images/FalseColorVariations.html • Hydice false color http://rst.gsfc.nasa.gov/Sect13/Sect13_10.html • False color Soap Bubble Neb http://www.noao.edu/image_gallery/images/d7/soapbubble-400.jpg • Amateur false colors http://sharmaastronet.ipage.com/Hi%2520res%2520pix%2520for%2520website/Nebulae/Orion%2520Nebula%2520Fullspec_Anjal%2520Sharma.jpg • Planetary nebulae spectra http://www.astroman.fsnet.co.uk/pnspect.htm • http://www.williams.edu/astronomy/research/PN/nebulae/ • color vision http://www-psych.stanford.edu/~lera/psych115s/notes/lecture5/images/color1.jpg • Primary and complementary CCD filters http://www.seas.gwu.edu/~poorvi/EI99.pdf • http://starizona.com/acb/ccd/advtheorycolor.aspx • Bayer filter transmissions http://micro.magnet.fsu.edu/primer/digitalimaging/cmosimagesensors.html • http://photo.net/photo/edscott/spectsel.htm • Spectral calculator? http://www.efg2.com/Lab/ScienceAndEngineering/Spectra.htm • http://www.cambridgeincolour.com/tutorials/color-spaces.htm
1) RGB --> color-by-color linear processing --> RGB • 2) Any 3 bands --> band-by-band linear processing --> RGB • 3) Any n bands --> color mixing linear processing --> RGB • 3a) Any 3 bands + lumoinosity --> band-by-band HSI processing --> RGB • 4) Any n bands --> non-linear thematic processing --> classification --> RGB • general discussion of applications • http://www.prairieastronomyclub.org/filters.htm • http://www.cloudynights.com/item.php?item_id=63 • NOVAC member photos • http://www.novac.com/MemberImages/Browse.php?RecordStart=40
Processing colors: different ways for different purposes Red-Green-Blue Coordinate System Hue-Saturation-Value Coordinate System