
INTRODUCTION
kDa m 1 2 1 2 m . 225 150 100 75 50 35 25 15 10. Electronic transference assessment of the redox processes at carbon electrodes coated with Geobacter sulfurreducens that grown at different temperatures.

INTRODUCTION
E N D
Presentation Transcript
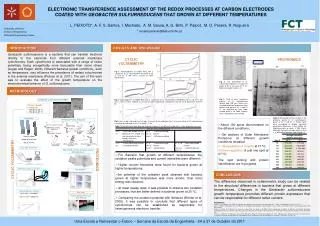
kDa m 1 2 1 2 m 225 150 100 75 50 35 25 15 10 Electronic transference assessment of the redox processes at carbon electrodes coated with Geobacter sulfurreducens that grown at different temperatures L. PEIXOTO*, A. F. S. Santos, I. Machado, A. M. Sousa, A. G. Brito, P. Parpot, M. O. Pereira, R. Nogueira * luciana.peixoto@deb.uminho.pt Geobacter sulfurreducens is a bacteria that can transfer electrons directly to the electrode from different external membrane cytochromes. Each cytochrome is associated with a range of redox potentials, being energetically more favourable than some others (Logan and Regan, 2006). Different bacterial growth conditions,, such as temperature, may influence the prevalence of certain cytochromes in the external membrane (Peixoto et al. 2011). The aim of this work was to evaluate the effect of the growth temperature on the electrochemical behavior of G. sulfurreducens. RESULTS AND DISCUSSION INTRODUCTION CYCLIC VOLTAMMETRY PROTEOMICS A ´ Differentbandswereobserved A Fig 1. Voltammograms of carbon Toray with a suspension of G. sulfurreducens that grew at 25 ºC and 37 ºC (50 mVs-1). (essays at room temperature) Fig4. 12% SDS-PAGE ofG. sulfurreducensproteins (1.6 g), thatgrownat 25 ºC (1) andat 37 ºC (2); Molecular weightmarkers (m). a b METHODOLOGY Fig 5. 2-DE of outer membrane proteins of G. sulfurreducens (protein load: 200 g). Proteins that revealed differential expression from bacteria that grow at 25 ºC and 37 ºC are indicated by their index number given in the Table. Proteins were visualized by silver staining. Geobacter sulfurreducens DSMZ Fig 2. Voltammograms of carbon Toray with a suspension of G. sulfurreducens that grew at 25 ºC and 37 ºC (25 mVs-1), after 24 hours stabilize (a). (essays at room temperature). Comparison with the result obtained in time 0 H (b). • Differentgrowthcondictions • 100 rpm & 25 ºC • 100 rpm & 37 ºC b a Table 2 Normalised intensity of spots in the proteome profile of G. sulfurreducensgrown at 25 ºC and 37 ºC. Protein spots were considered to display significant quantitative differences if they fulfilled the following criteria: p values ≤ 0.05 (t-test); detection threshold, average volume ≥ 20 (n = 3); differential tolerance, fold change ≥ 2 Electrodes Membrane Protein Extraction • About 100 spots discriminated on the different conditions; • Gel analysis of Outer Membrane Proteome at different growth conditions revealed: • Up-regulation of 9 spots at 37 ºC; • Down-regulation of just one spot at 37 ºC; • The spot picking and protein identification are in progress. Fig 3. log I vs. log v (▲) and E versus log v (◊) curves for the oxidation (Fig. 1) of a pure culture of G. sulfurreducens in suspension that grew at 25 ºC (a) and 37 ºC (b). 1) 2) 3) 4) Bacteriaingrowthmedium Centrifugeat 4 000 g 15min at 4 ºC PelletdilutedinTris-buffer Table 1 Electrochemical data obtained for bacteria grown at two different temperature. (room temperature essays). Sonication 6 x 10 s Solubilize in 1% Sodiumlaurylsarcosine Ultra-Centrifugeat 257 000 g 60min 6) 5) 7) Platin as cathode + CarbonToray as anode + SCE as reference Sucrosegradient 30% 50%70% Ultra-Centrifugeat 82 500 g 17 h at 4ºC Ultra-Centrifugeat 257 000 g 60min Scan Rate at 50 mVs-1 SDS- PAGE and Two-Dimensional Gel Electrophoresis • For Bacteria that growth at different temperatures, the oxidation peaks potentials and current intensities were different; • Higher current intensities were found for bacteria grown at higher temperatures; • the potential of the oxidation peak obtained with bacteria grown at higher temperature was more anodic, thus more energy was required; • At lower sweep rates, it was possible to observe two oxidation processes, that are better defined in bacteria grown at 25 ºC; • Comparing the oxidation potential with literature (Richter et al. 2009), it was possible to conclude that different types of cytochromes can be established as responsible for heterogeneous electronic transfer. CYCLIC VOLTAMMETRY PROTEOMICS Differentsweepscan rates Gel Analysis CONCLUSIONS The difference observed in voltammetric study can be related to the structural differences in bacteria that grown at different temperatures. Changes in the Geobacter sulfurreducens growth temperature promotes different protein expression that can be responsible for different redox centers. REFERENCES Logan, B.E. and Regan, J.M. (2006). “Electricity-producing bacterial communities in microbial fuel cells.”, Trends in Microbiology 14, No.12, 512-518. Qian, X. (2009). “Investigation of fe(iii) reduction in Geobacter sulfurreducens characterization of outer surface associated electron transfer components”. PhD Dissertations. Richter, H.; Nevin, K.P.; Daniel, H.J.; Lowy, A.; Lovley, D.R. and Tender, L.M. 2009. “Cyclic voltammetry of biofilms of wild type and mutant Geobacter sulfurreducens on fuel cell anodes indicates possible roles of OmcB, OmcZ, type IV pili, and protons in extracellular electron transfer.” Energy Environ Sci 2, 506-516. Peixoto L., Santos A.F.S., Machado I., Sousa A.M., Brito A.G., Parpot P., Pereira M.O., Nogueira R. 2011. “Influence of the Temperature in the electronic transfer mechanism of Geobacter sulfurreducens” In proceedings of the 3rd Microbial Fuel Cell Conference (Leeuwarden, Netherland. 6-8 Jun). 145. VoltammogramsAnalysis Next step Ep vs. Log v – reversibility + Log I vs. Log v – limitingstep ProteinIdentificationand Spot Picking A B A B 7.0 pI 4.0 MW


