Download
1 / 56
560 likes | 668 Views
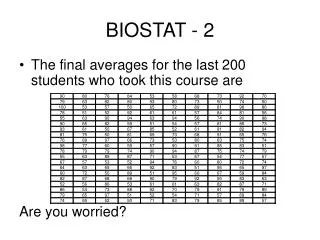
Biostat 200 Lecture 8. Review. The test statistics follow a theoretical distribution ( t stat follows the t distribution, F statistic follows the F distribution, z stat follows the Standard Normal) if certain assumptions are met. These assumptions are:

E N D
Review • The test statistics follow a theoretical distribution (tstat follows the t distribution, F statistic follows the F distribution, zstatfollows the Standard Normal) if certain assumptions are met. • These assumptions are: • For t-test and ANOVA, the underlying distribution of the random variable being measured (X) should be approximately normal • In reality the t-test is rather robust, so with large enough sample size and without very large outliers, it is ok to use the t-test • For the ANOVA, the variance of the subgroups should be approximately equal • For the Wilcoxon Rank Sum Test and the Kruskal-Wallis the underlying distributions must have the same basic shape
Categorical outcomes • With the exception of the proportion test, all the previous tests were for comparing numerical outcomes and categorical predictors • E.g., CD4 count by alcohol consumption • BMI by sex • We often have dichotomous outcomes and predictors • E.g. Had at least one cold in the prior 3 months by sex
We can make tables of the number of observations falling into each category • These are called contingency tables • E.g. At least one cold by sex . tab coldany sex | sex coldany | Male Female | Total -----------+----------------------+---------- 0 | 131 100 | 231 1 | 164 140 | 304 -----------+----------------------+---------- Total | 295 240 | 535
Contingency tables • Often summaries of counts of disease versus no disease and exposed versus not exposed • Frequently 2x2 but can generalize to n x k • n rows, k columns • Note that Stata sorts on the numeric value, so for 0-1 variables the disease state will be the 2nd row
Contingency tables • Contingency tables are usually summaries of data that originally looked like this.
. list coldany sex +------------------+ | coldany sex | |------------------| 1. | yes male | 2. | no male | 3. | yes female | 4. | yes female | 5. | no male | |------------------| 6. | no male | 7. | no male | 8. | yes male | 9. | yes male | 10. | yes male | |------------------| 11. | no female | 12. | yes male | 13. | no male | 14. | yes female | 15. | no female | |------------------| 16. | yes female | . list coldany sex, nolabel +---------------+ | coldany sex | |---------------| 1. | 1 0 | 2. | 0 0 | 3. | 1 1 | 4. | 1 1 | 5. | 0 0 | |---------------| 6. | 0 0 | 7. | 0 0 | 8. | 1 0 | 9. | 1 0 | 10. | 1 0 | |---------------| 11. | 0 1 | 12. | 1 0 | 13. | 0 0 | 14. | 1 1 | 15. | 0 1 | |---------------| 16. | 1 1 |
We want to know whether the incidence of colds varies by gender. • We could test the null hypothesis that the cumulative incidence of ≥1 cold in males equals that of females. The cumulative incidence is a proportion. H0: pmales= pfemales HA: pmales≠ pfemales
. prtest coldany, by(sex) Two-sample test of proportion Male: Number of obs = 295 Female: Number of obs = 240 ------------------------------------------------------------------------------ Variable | Mean Std. Err. z P>|z| [95% Conf. Interval] -------------+---------------------------------------------------------------- Male | .5559322 .0289284 .4992336 .6126308 Female | .5833333 .0318234 .5209605 .6457061 -------------+---------------------------------------------------------------- diff | -.0274011 .0430068 -.1116929 .0568906 | under Ho: .0430575 -0.64 0.525 ------------------------------------------------------------------------------ diff = prop(Male) - prop(Female) z = -0.6364 Ho: diff = 0 Ha: diff < 0 Ha: diff != 0 Ha: diff > 0 Pr(Z < z) = 0.2623 Pr(|Z| < |z|) = 0.5245 Pr(Z > z) = 0.7377
There are other methods to do this (chi-square test) • Why? • These methods are more general – can be used when you have more than 2 levels in either variable • We will start with the 2x2 example however
Overall, the cumulative incidence of least one cold in the prior 3 months is 304/535=.568. This is the marginal probability of having a cold • There were 295 males and 240 females • Under the null hypothesis, the expected cumulative incidence in each group is the overall cumulative incidence • So we would expect 295*.568=167.6 with at least one cold in the males, and 240*.568=136.3 with at least one cold in the females . tab coldany sex | sex coldany | Male Female | Total -----------+----------------------+---------- 0 | 131 100 | 231 1 | 164 140 | 304 -----------+----------------------+---------- Total | 295 240 | 535
We can also calculate the expected number with no colds under the null hypothesis of no difference • Males: 295*(1-.568) = 127.4 • Females: 240*(1-.568) = 103.7 • We can make a table of the expected counts EXPECTED COUNTS UNDER THE NULL HYPOTHESIS | sex coldany | Male Female | Total -----------+----------------------+---------- 0 | 127.4 103.7 | 231 1 | 167.6 136.3 | 304 -----------+----------------------+---------- Total | 295 240 | 535 Observed data . tab coldany sex | sex coldany | Male Female | Total -----------+----------------------+---------- 0 | 131 100 | 231 1 | 164 140 | 304 -----------+----------------------+---------- Total | 295 240 | 535
The Chi-square test compares the observed frequency (O) in each cell with the expected frequency (E) under the null hypothesis of no difference • The differences O-E are squared, divided by E, and added up over all the cells • The sum of this is the test statistic and follows a chi-square distribution
Chi-square test of independence • The chi-square test statistic (for the test of independence in contingency tables) for a 2x2 table (dichotomous outcome, dichotomous exposure) • i is the index for the cells in the table – there are 4 cells • This test statistic is compared to the chi-square distribution with 1 degree of freedom
Chi-square test of independence • The chi-square test statistic for the test of independence in an nxk contingency table is • This test statistic is compared to the chi-square distribution • The degrees of freedom for the this test are (n-1)*(k-1), so for a 2x2 there is 1 degree of freedom • n=the number of rows; k=the number of columns in the nxk table • The chi-square distribution with 1 degree of freedom is actually the square of a standard normal distribution • Expected cell sizes should all be >1 and <20% should be <5 • The Chi-square test is for two sided hypotheses
Chi-square distribution Mean = degrees of freedom Variance = 2*degrees of freedom
Chi-square test of independence • For the example, the chi-square statistic for our 2x2 is (131-127.4)2 /127.4 + (100-103.7)2 /103.7 + (164-167.6)2 /167.6 + (140-136.3)2 /136.3 = .405 • There is 1 degree of freedom • Probability of observing a chi-square value with 1 degree of freedom of .405 is .525 . di chi2tail(1,.405) .52451828 Fail to reject the null hypothesis of independence
. tab coldany sex, chi | sex coldany | Male Female | Total -----------+----------------------+---------- 0 | 131 100 | 231 1 | 164 140 | 304 -----------+----------------------+---------- Total | 295 240 | 535 Pearson chi2(1) = 0.4050 Pr = 0.525 p-value Test statistic (df)
If you want to see the row or column percentages, use row or col options . tab coldany sex, row col chi expected +--------------------+ | Key | |--------------------| | frequency | | expected frequency | | row percentage | | column percentage | +--------------------+ | sex coldany | Male Female | Total -----------+----------------------+---------- 0 | 131 100 | 231 | 127.4 103.6 | 231.0 | 56.71 43.29 | 100.00 | 44.41 41.67 | 43.18 -----------+----------------------+---------- 1 | 164 140 | 304 | 167.6 136.4 | 304.0 | 53.95 46.05 | 100.00 | 55.59 58.33 | 56.82 -----------+----------------------+---------- Total | 295 240 | 535 | 295.0 240.0 | 535.0 | 55.14 44.86 | 100.00 | 100.00 100.00 | 100.00 Pearson chi2(1) = 0.4050 Pr = 0.525
Because we using discrete cell counts to approximate a chi-squared distribution, for 2x2 tables some use the Yatescorrection • Not computed in Stata
Lexicon • When we talk about the chi-square test, we are saying it is a test of independence of two variables, usually exposure and disease. • We also say we are testing the “association” between the two variables. • If the test is statistically significant (p<0.05 if =0.05), we often say that the two variables are “not independent” or they are “associated”.
Test of independence • For small cell sizes in 2x2 tables, use the Fisher exact test • It is based on a discrete distribution called the hypergeometric distribution • For 2x2 tables, you can choose a one-sided or two-sided test . tab coldany sex, chi exact | sex coldany | Male Female | Total -----------+----------------------+---------- 0 | 131 100 | 231 1 | 164 140 | 304 -----------+----------------------+---------- Total | 295 240 | 535 Pearson chi2(1) = 0.4050 Pr = 0.525 Fisher's exact = 0.540 1-sided Fisher's exact = 0.292
Comparison to test of two proportions . prtest coldany, by(sex) Two-sample test of proportion Male: Number of obs = 295 Female: Number of obs = 240 ------------------------------------------------------------------------------ Variable | Mean Std. Err. z P>|z| [95% Conf. Interval] -------------+---------------------------------------------------------------- Male | .5559322 .0289284 .4992336 .6126308 Female | .5833333 .0318234 .5209605 .6457061 -------------+---------------------------------------------------------------- diff | -.0274011 .0430068 -.1116929 .0568906 | under Ho: .0430575 -0.64 0.525 ------------------------------------------------------------------------------ diff = prop(Male) - prop(Female) z = -0.6364 Ho: diff = 0 Ha: diff < 0 Ha: diff != 0 Ha: diff > 0 Pr(Z < z) = 0.2623 Pr(|Z| < |z|) = 0.5245 Pr(Z > z) = 0.7377 --- For 2x2 tables the chi-square statistic is equal to the z statistic squared . di .6364^2 .40500496
Chi-square test of independence • The chi-square test can be used for more than 2 levels of exposure (with a dichotomous outcome) • The null hypothesis is p1 = p2 = ... = pk • The alternative hypothesis is that not all the proportions are the same • Note that, like ANOVA, a statistically significant result does not tell you which level differed from the others • Also when you have more than 2 groups, all tests are 2-sided • The degrees of freedom for the test are k-1
Chi-square test of independence . tab coldany racegrp, chi col exact +-------------------+ | Key | |-------------------| | frequency | | column percentage | +-------------------+ Enumerating sample-space combinations: stage 3: enumerations = 1 stage 2: enumerations = 4 stage 1: enumerations = 0 | racegrp coldany | White, Ca Asian/PI Other | Total -----------+---------------------------------+---------- 0 | 132 71 30 | 233 | 42.44 44.94 44.12 | 43.39 -----------+---------------------------------+---------- 1 | 179 87 38 | 304 | 57.56 55.06 55.88 | 56.61 -----------+---------------------------------+---------- Total | 311 158 68 | 537 | 100.00 100.00 100.00 | 100.00 Pearson chi2(2) = 0.2819 Pr = 0.869 Fisher's exact = 0.877
Another way to state the null hypothesis for the chi-square test: • Factor A is not associated with Factor B • The alternative is • Factor A is associated with Factor B • For more than 2 levels of the outcome variable this would make the most sense • The degrees of freedom are (r-1)*(c-1) (r=rows, c=columns)
Note that this is a 3x3 table, so the chi-square test has 2x2=4 degrees of freedom . . . tab cold3grp racegrp , chi col exact +-------------------+ | Key | |-------------------| | frequency | | column percentage | +-------------------+ | racegrp cold3grp | White, Ca Asian/PI Other | Total -----------+---------------------------------+---------- No colds | 132 71 30 | 233 | 42.44 44.94 44.12 | 43.39 -----------+---------------------------------+---------- One cold | 120 50 21 | 191 | 38.59 31.65 30.88 | 35.57 -----------+---------------------------------+---------- >1 cold | 59 37 17 | 113 | 18.97 23.42 25.00 | 21.04 -----------+---------------------------------+---------- Total | 311 158 68 | 537 | 100.00 100.00 100.00 | 100.00 Pearson chi2(4) = 3.6227 Pr = 0.459 Fisher's exact = 0.450
Paired dichotomous data • Matched pairs • Matched case-control study • Before and after data • You cannot just put each individual into an exposure and disease box, because then you would lose the benefits of pairing (and the observations would not be independent!) • Instead you have a table that tabulates each of the 4 possible states for each pair
Paired dichotomous data • For a 1:1 matched case/control study, in all pairs, 1 has the disease (case) and 1 does not (control). The table then counts the number of pairs in which • 1. Both were exposed • 2. Neither were exposed • 3. The case was exposed, the control was not • 4. The case was not exposed, the control was exposed
Case-control studyHIV positives on ART in Uganda • The study question was: Is alcohol consumption associated with treatment failure? • The null hypothesis is that alcohol consumption is not associated with treatment failure • Cases: Treatment failure: HIV viral load after 6 months of ART >400 • Controls: HIV viral load <400 • Matched on sex, duration on treatment, and treatment regimen class
The test statistic is • r and s are the number of discordant pairs • Concordant pairs provide no information • Under the null hypothesis, r and s would be equal • This statistic has an approximate chi-square distribution with 1 degree of freedom • The test is called McNemar’s test • The -1 is a continuity correction, not all versions of the test use this, some use .5
r=9, s=3 • Test statistic = (6-1)^2/12 = 2.083 . di chi2tail(1,2.083) .14894719 • Test statistic = (6)^2/12 = 3 (Not using the continuity correction) di chi2tail(1,3) .08326452
In Stata, use mcc for Matched Case Control mcc case_exposed control_exposed . mcc lastalc_case lasttime_alc_3mos | Controls | Cases | Exposed Unexposed | Total -----------------+------------------------+------------ Exposed | 4 9 | 13 Unexposed | 3 11 | 14 -----------------+------------------------+------------ Total | 7 20 | 27 McNemar's chi2(1) = 3.00 Prob > chi2 = 0.0833 Exact McNemar significance probability = 0.1460 Proportion with factor Cases .4814815 Controls .2592593 [95% Conf. Interval] --------- -------------------- difference .2222222 -.0518969 .4963413 ratio 1.857143 .9114712 3.78397 rel. diff. .3 .0159742 .5840258 odds ratio 3 .7486845 17.228 (exact)
Use mcci if you only have the table, not the raw data mcci #both_exposed #case_exposed_only #control_exposed_only #neither_exposed . mcci 4 9 3 11 | Controls | Cases | Exposed Unexposed | Total -----------------+------------------------+------------ Exposed | 4 9 | 13 Unexposed | 3 11 | 14 -----------------+------------------------+------------ Total | 7 20 | 27 McNemar's chi2(1) = 3.00 Prob > chi2 = 0.0833 Exact McNemar significance probability = 0.1460 Proportion with factor Cases .4814815 Controls .2592593 [95% Conf. Interval] --------- -------------------- difference .2222222 -.0518969 .4963413 ratio 1.857143 .9114712 3.78397 rel. diff. .3 .0159742 .5840258 odds ratio 3 .7486845 17.228 (exact)
Note that the McNemar test is only for MATCHED case/control data!!! • It is quite possible to collect unmatched case control data. Then you analyze using the chi-square methods presented earlier.
Paired dichotomous data • For before and after data, the pairs are the individual participant, and the four outcomes might be: 1. “Yes” before + “Yes” after (no change) 2. “No” before + “No” after (no change) 3. “Yes” before + “No” after 4. “No” before + “Yes” after • E.g. Reporting alcohol consumption before and after being consented to a study in which blood and urine will be tested for an alcohol biomarker
Self-reported alcohol consumption in UgandaMcNemar’s test for paired data • Null hypothesis: The groups change their self-reported alcohol consumption equally
Matched case-control study command . mcci 12 13 0 37 | Controls | Cases | Exposed Unexposed | Total -----------------+------------------------+------------ Exposed | 12 13 | 25 Unexposed | 0 37 | 37 -----------------+------------------------+------------ Total | 12 50 | 62 McNemar's chi2(1) = 13.00 Prob > chi2 = 0.0003 Exact McNemar significance probability = 0.0002 Proportion with factor Cases .4032258 Controls .1935484 [95% Conf. Interval] --------- -------------------- difference .2096774 .0922202 .3271346 ratio 2.083333 1.385374 3.132929 rel. diff. .26 .138419 .381581 odds ratio . 3.04772 . (exact)
Comparison of disease frequencies across groups • The chi-square test and McNemar’s test are tests of independence • They does not give us an estimate of how much the two groups differ, i.e. how much the disease outcome varies by the exposure variable • We use odds ratios (OR) and relative risks (RR) as measures of ratios of disease outcome (given exposure or lack of exposure) • The odds ratio and the relative risk are just two examples of “measures of association”
Comparison of disease frequencies – relative risk • Risk ratio (or relative risk or relative rate) = P (disease | exposed) / P(disease | unexposed) = Re / Ru= a/(a+c) / b/(b+d)
Comparison of disease frequencies – relative risk • Note that you cannot calculate this entity when you have chosen your sample based on disease status • I.e. Case-control study – you have fixed a prior the probability of disease! Relative risk is a NO GO! • You can calculate it but it won’t have any meaning…
Odds • If an event occurs with probability p, the odds of the event are p/(1-p) to 1 • If an event has probability .5, the odds are 1:1 • Conversely, if the odds of an event are a:b, the probability of a occurring is a/(a+b) • The odds of horse A winning over horse B winning are 2:1 the probability of horse A winning is .667.
Odds ratio • Odds of disease among the exposed persons = P(disease | exposed) / (1-P(disease | exposed)) = [ a / (a + c) ] / [ c / (a + c) ] = a/c • Odds of disease among the unexposed persons = P(disease | unexposed) / (1-P(disease | unexposed)) = [ b / (b + d) ] / [ d / (b + d) ] = b/d • Odds ratio = a/c / b/d = ad/bc
Odds ratio note • Note that the odds ratio is also equal to [ P(exposed | disease)/(1-P(exposed |disease) ] / [ P(exposed | no disease)/(1-P(exposed | no disease) ] • This is needed for case-control studies in which the proportion with disease is fixed (so you can’t calculate the odds of disease)
Interpretation of ORs and RRs • If the OR or RR equal 1, then there is no effect of exposure on disease. • If the OR or RR >1 then disease is increased in the presence of exposure. (Risk factor) • If the OR or RR <1 then disease is decreased in the presence of exposure. (Protective factor)
Comparison of measures of association • When a disease is rare, i.e. the risk is <10%, the odds ratio approximates the risk ratio • The odds ratio overestimates the risk ratio • Why use it? – statistical properties, usefulness in case-control studies
The association of having at least one cold with gender tab coldany sex | sex coldany | Male Female | Total -----------+----------------------+---------- 0 | 131 100 | 231 1 | 164 140 | 304 -----------+----------------------+---------- Total | 295 240 | 535 What is the (estimated) odds ratio?