Download
1 / 1
10 likes | 159 Views
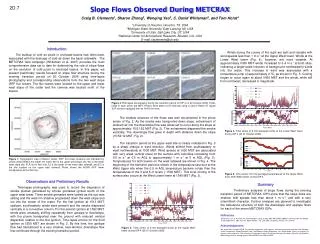
2D.7. Slope Flows Observed During METCRAX. Craig B. Clements 1 , Sharon Zhong 2 , Wenqing Yao 2 , C. David Whiteman 3 , and Tom Horst 4 1 University of Houston, Houston, TX, USA 2 Michigan State University, East Lansing, MI, USA 3 University of Utah, Salt Lake City, UT, USA

E N D
2D.7 Slope Flows Observed During METCRAX Craig B. Clements1, Sharon Zhong2, Wenqing Yao2, C. David Whiteman3, and Tom Horst4 1University of Houston, Houston, TX, USA 2Michigan State University, East Lansing, MI, USA 3University of Utah, Salt Lake City, UT, USA 4National Center for Atmospheric Research, Boulder, CO, USA E-mail: cbclements@uh.edu Introduction The buildup of cold air pools in enclosed basins has often been associated with the drainage of cold air down the basin sidewalls. The METCRAX field campaign (Whiteman et al. 2007) provides the most comprehensive data set to date for determining the role of slope flows on the evolution of cold pools in enclosed basins. In this paper, we present preliminary results focused on slope flow structure during the evening transition period on 20 October 2006 using time-lapse photography and corresponding observations from the two west slope ISFF flux towers. The flux towers were located on the upper and lower west slope of the crater and the camera was located north of the towers. Winds during the course of the night are light and variable with wind speeds less than 1 m s-1 at the Upper West tower. Winds at the Lower West tower (Fig. 4), however, are more variable. At approximately 0300 MST winds increased to 3-4 m s-1 at both sites, indicating a larger-scale intrusion of background northwesterly winds into the crater. This increase in wind was associated with a temperature jump of approximately 2 ºC, as shown in Fig. 5. Cooling began to occur again at about 0430 MST and the winds, while still from northwest, decreased in magnitude. Figure 2.Time lapse photography during the transition period of IOP 4 on 20 October 2006. Times listed in each photo are MST. Photos were taken at 5s intervals using a Canon Rebel XT digital SLR camera equipped with an 18-55 mm lens. The shallow structure of the flows was well documented in the photo series of Fig. 2. As the smoke was transported down slope, entrainment of ambient air into the downslope flow was observed to occur along the slope at approximately 15:51:52 MST (Fig. 2). This entrainment dispersed the smoke vertically. The downslope flow grew in depth with distance down the slope (15:52:12 MST; Fig. 2). The transition period at the upper west site is clearly indicated in Fig. 3 by a sharp change in wind direction. Winds shifted from southeasterly to west northwesterly at 1530 MST. Wind speeds at 1630 MST are associated with very weak vertical shear at the surface with velocities increasing from 0.5 m s-1 at 0.5 m AGL to approximately 1 m s-1 at 5 m AGL (Fig. 3). Temperatures for both towers on the west sidewall are shown in Fig. 4. The beginning of the transition period is shown in the temperature structure at the West Upper site when the 0.5 m AGL temperature became colder than the temperatures of the 3 and 5 m levels (~1500 MST). This local cooling of the surface also occurs at the West Lower tower at 1545 MST (Fig. 3). Figure 4. Time series of 5-min-averaged winds at the Lower West tower during IOP 4 (20-21 October 2006). Figure 1. Topographic map of Meteor Crater. ISFF flux tower locations are indicated by circles where RIM is the crater rim tower, WU is the upper west slope site, WL is the lower west slope site, FLR is the floor site, EL is the tower on the lower east sidewall, and EU is the site located on the upper east sidewall. Photo shows the NCAR ISFF tower configuration at the WU site. Figure 5. Time series of 5 min-averaged-temperatures at the Upper West and Lower West towers during IOP 4. Observations and Preliminary Results Time-lapse photography was used to record the dispersion of smoke plumes generated by smoke grenades ignited south of the upper west tower. Three smoke grenades were ignited as the sun was setting and the west rim shadow progressed down the west slope and out into the center of the crater. For the first ignition at 1513 MST, upslope, southeasterly winds were present and the smoke dispersed vertically in a convective column, For the second ignition at 1532 MST, winds were unsteady, shifting repeatedly from upslope to downslope, with the plume transported near the ground with reduced vertical dispersion relative to the first ignition. Time lapse photos for the third ignition at 1550 MST are shown in Fig. 2. By this time, the upslope flow had transitioned to a very shallow, near-laminar, downslope flow that continued through the evening transition period. Summary Preliminary analyses of slope flows during the evening transition period of METCRAX IOP4 show that the slope flows are shallow, with speeds less than about 1 m s-1, and with a very intermittent character. Further analyses are planned to investigate the turbulence structure of both the downslope and upslope flows for each of the seven METCRAX IOPs. References Whiteman, C.D., S. W. Hoch, M. Hahnenberger, and S. Zhong, 2007: METCRAX 2006-First Results from the Meteor Crater Experiment. 29th Intl Conf. Alpine Meteor., 4-8 June 2007, Chambéry, France. This volume. Acknowledgements We would like to thankNCAR for providing equipment, field support, and data processing services and Barringer Crater Corporation (Drew Barringer, Pres.) and Meteor Crater Enterprises, Inc. (Brad Andes, Pres.) for granting us access to the crater site. This research is supported by the U.S National Science Foundation Physical and Dynamic Meteorology Division through grants ATM-0444807 and ATM-0444205. Figure 3. Time series of 5-min-averaged winds at the Upper West tower during IOP 4 (20-21 October 2006). .