Download
1 / 48
590 likes | 1.14k Views
Genetics and Probability. Genetics is the study of inheritance, but it is also a study of probability. Genetics and Probability. Genetics is the study of inheritance, but it is also a study of probability

E N D
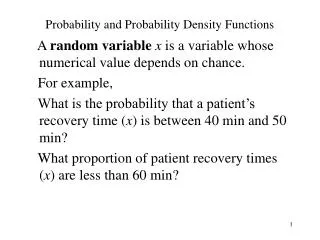
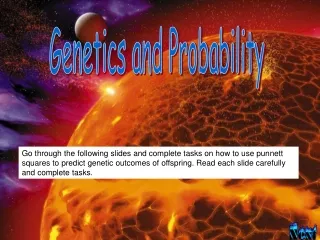
Genetics and Probability Genetics is the study of inheritance, but it is also a study of probability
Genetics and Probability Genetics is the study of inheritance, but it is also a study of probability most eukaryotic organisms are diploid, meaning that each cell contains two copies of every chromosome, so there are two copies of each gene that controls a trait (alleles).
Genetics and Probability Genetics is the study of inheritance, but it is also a study of probability most eukaryotic organisms are diploid, meaning that each cell contains two copies of every chromosome, so there are two copies of each gene that controls a trait (alleles). In sexual reproduction, these two copies of each chromosome separate, and are randomly sorted into the reproductive cells (gametes). When gametes from two different parents combine in fertilization, new combinations of alleles are created.
Genetics and Probability • the inheritance of characteristics is the result of random chance
Genetics and Probability • the inheritance of characteristics is the result of random chance • the genes that an individual organism inherits depends on the “luck of the draw,” and the luck of the draw is dependent on the laws of probability.
Laws of Probability 1. The Rule of Independent Events: Past events have no influence on future events.
Laws of Probability • The Rule of Independent Events: Past events have no influence on future events. • Question: If a coin is tossed 5 times, and each time a head appears, then what is the chance that the next toss will be heads?
Laws of Probability • The Rule of Independent Events: Past events have no influence on future events. • Question: If a coin is tossed 5 times, and each time a head appears, then what is the chance that the next toss will be heads? • Answer: 1/2 (1 chance in 2), because coins have 2 sides
Laws of Probability 2. The Rule of Multiplication: The chance that two or more independent events will occur together is equal to the product of the probabilities of each individual event
Laws of Probability 2. The Rule of Multiplication: The chance that two or more independent events will occur together is equal to the product of the probabilities of each individual event • Question: What are the chances of drawing a red nine from a standard deck of cards?
Laws of Probability 2. The Rule of Multiplication: The chance that two or more independent events will occur together is equal to the product of the probabilities of each individual event • Question: What are the chances of drawing a red nine from a standard deck of cards? • Answer: 1/26 (1 chance in 26), because there is 1/2 chance of drawing a red card and 1 chance in 13 of drawing a nine. Therefore, 1/2 x 1/13 = 1/26 or 1 chance in 26 of drawing a red nine.
Laws of Probability • The Rule of Addition: The chance of an event occurring when that event can occur two or more different ways is equal to the sum of the probabilities of each individual event
Laws of Probability • The Rule of Addition: The chance of an event occurring when that event can occur two or more different ways is equal to the sum of the probabilities of each individual event • Question: If 2 coins are tossed, what is the chance that the toss will yield 2 unmatched coins (1 head & 1 tail)?
Laws of Probability • The Rule of Addition: The chance of an event occurring when that event can occur two or more different ways is equal to the sum of the probabilities of each individual event • Question: If 2 coins are tossed, what is the chance that the toss will yield 2 unmatched coins (1 head & 1 tail)? • Answer: 1/2 (1 chance in 2) because the combination of 2 unmatched coins can come about in 2 ways: Result A (coin #1 heads, coin #2 tails) as well as Result B(coin #1 tails, coin #2 heads). Therefore (1/2 x 1/2) + (1/2 x 1/2) = 1/2, or the chance of Result A plus the chance of Result B.
Paired Coins and Genetics • Using paired coins, in fact, mimics genetics closely. Each coin can serve as the model for a gamete during fertilization, because it’s the ”luck of the draw” governing which sperm fertilizes which egg. • When you toss two coins, there are three possible outcomes. Use the laws to calculate the probability for each of these outcomes. • 2 heads • 2 tails • 1 head, 1 tail
Paired Coins and Genetics • 2 heads: 1/4 chance 1/2 heads on coin #1 x 1/2 heads on coin #2 = 1/4, which is generalized as p2 because [p x p = p2]
Paired Coins and Genetics 2 tails: 1/4 chance 1/2 tails on coin #1 x 1/2 tails on coin #2 = 1/4, which is generalized as q2 because [q x q = q2]
Paired Coins and Genetics 1 head, 1 tail: 1/2 chance (1/2 heads on coin #1 x 1/2 tails on coin #2) + (1/2 tails on coin #1 x 1/2 heads on coin #2), which is generalized as 2pq because [(p x q) + (q x p) = 2pq]
Paired Coins and Genetics Therefore, all the expected results from tossing two coins can be summarized as follows: p2+ 2pq + q2= 1 (double heads) + (heads/tails) + (double tails) = 100%
Chi-square Analysis • The Chi-square is a statistical test that makes a comparison between the data collected in an experiment verses the data you expected to find.
Chi-square Analysis • The Chi-square is a statistical test that makes a comparison between the data collected in an experiment verses the data you expected to find. • Can be used outside of genetics anytime you want to compare differences between expected results and experimental data
Chi-square Analysis • The Chi-square is a statistical test that makes a comparison between the data collected in an experiment verses the data you expected to find. • Can be used outside of genetics anytime you want to compare differences between expected results and experimental data • Used in genetics to evaluate data from experimental crosses to determine if the assumed genetic explanation is supported by the data.
Chi-square Analysis • The Chi-square test helps you to decide if the difference between your observed results and your expected results is probably due to random chance alone,or if there is some other factor influencing the results.
Chi-square Analysis • Is the variance in your data probably due to random chance alone and therefore your hypothesis about the genetics of a trait is supported by the data?
Chi-square Analysis • Is the variance in your data probably due to random chance alone and therefore your hypothesis about the genetics of a trait is supported by the data? • Are the differences between the observed and expected results probably not due to random chance alone, and your hypothesis about the genetics of a trait is thereby not supported by the data?
Chi-square Analysis • Is the variance in your data probably due to random chance alone and therefore your hypothesis about the genetics of a trait is supported by the data? • Are the differences between the observed and expected results probably not due to random chance alone, and your hypothesis about the genetics of a trait is thereby not supported by the data? • Should you consider an alternative inheritance mechanism to explain the results?
Chi-square Analysis • Is the variance in your data probably due to random chance alone and therefore your hypothesis about the genetics of a trait is supported by the data? • Are the differences between the observed and expected results probably not due to random chance alone, and your hypothesis about the genetics of a trait is thereby not supported by the data? • Should you consider an alternative inheritance mechanism to explain the results? The Chi-square test will not, in fact, prove or disprove if random chance is the only thing causing observed differences, but it will give an estimate of the likelihood that chance alone is at work.
Chi Square formula X2 = ∑ (observed – expected) 2 expected
Degrees of Freedom • Degrees of Freedom determine which rowwe use in the Chi-square Distribution table
Degrees of Freedom • Degrees of Freedom determine which rowwe use in the Chi-square Distribution table • The degrees of freedom are calculated as the one less than the number of possible results in your experiment.
Degrees of Freedom • Degrees of Freedom determine which row we use in the Chi-square Distribution table • The degrees of freedom are calculated as the one less than the number of possible results in your experiment. • In the double coin toss exercise, you have 3 possible results: two heads, two tails, or one of each. Therefore, there are two degrees of freedom
Degrees of Freedom • In a sense degrees of freedom is measuring how many classes of results can “freely”vary their numbers. • In other words, if you have an accurate count of how many 2-heads,and 2-tails tosses were observed, then you already know how many of the 100 tosses ended up as mixed head-tails, so the third measurement provides no additional information.
Probability • Probability determines which columnwe use in the Chi-square Distribution table
Probability • Probability determines which columnwe use in the Chi-square Distribution table • The columns in the Chi-square Distribution table with the decimals from .99 through .50 to .01 refer to probability levels of the Chi-square or the likely hood that the hypothesized factor is indeed the cause of the measured results.
Probability • If we calculate a Chi-square value of 1.386 (using the formula) from the experiment, then when we look this up on the Chi-square Distribution chart (in the 2 degrees of freedom row), we find that our Chi-square value places us in the “p=.50” column.
Probability • If we calculate a Chi-square value of 1.386 (using the formula) from the experiment, then when we look this up on the Chi-square Distribution chart (in the 2 degrees of freedom row), we find that our Chi-square value places us in the “p=.50” column. • This means that the variance between our observed results and our expected results would occur from random chance alone about 50% of the time.
Probability • Therefore, we could conclude that chance alone could cause such a variance often enough that the data still supported our hypothesis, and probably another factor is not influencing our coin toss results because it is well within the accept null hypothesis range
Probability • Therefore, we could conclude that chance alone could cause such a variance often enough that the data still supported our hypothesis, and probably another factor is not influencing our coin toss results because it is well within the accept null hypothesis range
Probability • What if the value after calculation was 5.991 or higher?
Probability • What if the value after calculation was 5.991 or higher? • we find that our Chi-square value places us in the “p=.05” column. • This means that the variance between our observed results and our expected results would occur from random chance alone only about 5% of the time (only 1 out of every 20 times). • chance factors alone are not likely to be the cause of this variance. Weighted coin??
Probability • Biologists generally accept p=.05 as the cutoff for accepting or rejecting a hypothesis. A p value of .05 or less is a “statistically significant” difference.
Null hypothesis • Says that when you predict the ratios of phenotypes that you would expect from a cross, it establishes a hypothesis that any difference in results will not be significant and will be due to random chance alone
Null hypothesis • Says that when you predict the ratios of phenotypes that you would expect from a cross, it establishes a hypothesis that any difference in results will not be significant and will be due to random chance alone • you propose that nothing else — no other factors — are creating the variation in your results except for random chance differences.
To summarize • After collecting data on a cross, you would then compare your observed results against your expected results and complete a Chi-square analysis.
To summarize • After collecting data on a cross, you would then compare your observed results against your expected results and complete a Chi-square analysis. • If the p value is determined to be greater than .05 then you would accept your null hypothesis (differences are due to random chance alone) and your genetic explanation for this trait is supported.
To summarize • After collecting data on a cross, you would then compare your observed results against your expected results and complete a Chi-square analysis. • If the p value is determined to be greater than .05 then you would accept your null hypothesis (differences are due to random chance alone) and your genetic explanation for this trait is supported. • If the p value is determined to be .05 or less then you would reject your null hypothesis — random chance alone can only explain this level of difference fewer than 1 time out of every 20 times — and your genetic explanation for this trait is unsupported. You therefore have to consider alternative factors influencing the inheritance of the mutant trait.
Stating conclusions • As a scientist, you would state your "acceptable" results from the Chi-square analysis in this way: "The differences observed in the data were not statistically significant at the .05 level." You could then add a statement like, "Therefore the data support the hypothesis that..."
Stating conclusions • To state "unacceptable" results from the Chi-square analysis: "The differences observed in the data were statistically significant at the .05 level." You could then add a statement like, "Therefore the data do not support the hypothesis that...”