Download
1 / 34
340 likes | 434 Views
Two pion correlations at SPS energies. Dariusz Anto ń czyk Institut fuer Kernphysik Frankfurt. 11-14 .09.2008. Workshop on Particle Correlations and Femtoscopy 2008 Krakow, Poland. Outline. Overview of SPS runs Experimental setups

E N D
Two pion correlations at SPS energies Dariusz Antończyk Institut fuer Kernphysik Frankfurt 11-14.09.2008 Workshop on Particle Correlations and Femtoscopy 2008 Krakow, Poland
Outline Overview of SPS runs Experimental setups Two particle analysis approach Energy dependence of HBT radii Reaction plane dependency analysis of HBT radii Discussion and Comments
1990 1992 1994 1996 1998 2000 2002 2004 2006 2008 Historic overview of SPS runs • First beam more then 20 years ago • In 1986, 16O accelerated to 60 AGeV • Many experiments, covering broad spectrum of physics topics, including HBT. • Recently, HBT analysis performed by CERES/NA45, NA49, NA57. 114In 158A GeV NA49/SHINE 207Pb 20A GeV 30A GeV NA45/CERES 40A GeV NA57 80A GeV 158A GeV 12O / 32S 60/200A GeV
Experimental Setups CERES – Nucl. Phys. A714 (2003) 124 Re-analysis of CERES HBT results for total available statistic and improved momentum, centrality and reaction plane resolution. NA49 – PRC 77, 064908 (2008) NA57 – J. Phys. G: 34 (2007) 403-429
Two particle analysis approach (1) Correlation function Analysis frame Bertsch-Pratt (qlong-qside-qout ) coordinate system in LCMS mean transverse pair momentum
Two particle analysis approach (2) • Standard Gaussian fit used by all experiments • Fitting algorithm • CERES and NA57 maximum likelihood assuming Poison distribution • NA49 minimization of 2 • No common method for removing Coulomb impact on HBT radii with i,j = out, side, long
Projection of correlation functions CERES 158 AGeV w/o Coulomb w. Coulomb
HBT radii vs. k┴ Centrality: CERES 0-5 % NA49 0-7.5% Analysis of 80 GeV by S.Schichmann (IKF)
HBT radii vs. k┴ Centrality: CERES 0-5 % NA49 0-7.5%
HBT radii @ 40AGev Centrality: CERES 0-5 % 5-10 % NA49 0-7.5 % NA57 0-11 % J. Phys. G: 34 (2007) 403-429
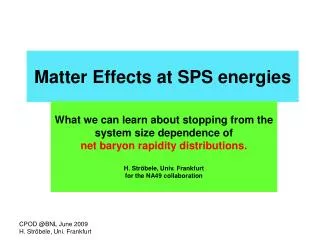
Beam energy systematics PRL 90 (2003) 022301 Freeze-out volume has a minimum at a beam energy of 10-40 AGeV Nσ, particle multiplicity times mean hadron-hadron cross-section,has a similar beam energy dependence Vf / Nσ = λ f = 1 fm independent of beam energy Freeze-out when mean free path 1 fm
Mean free path • Extended with recent • data from RHIC • data by NA49, NA35 Including heavy and light systems Agreement with fy1fm for all energies and systems 1 Universal pion freeze-out condition Compilation by S.Schuchmann (IKF)
HBT vs. Reaction Plane • Reaction plane orientation from second Fourier harmonic • recentering (Step 1) • dividing by width of X, Y distribution, respectively (Step 2)
Resolution of the reaction plane angle Obtained reaction plane resolution 31-38 (centrality dependence) Ollitrault, arXiv:nucl-ex/9711003 (Met. 1) Poskanzer , Voloshin, Phys. Rev. C58(1998)1671 (Met. 2)
Rside Rout Rlong HBT vs. RP - analysis strategy • HBT radii vs. reaction plane orientation probe spatialanisotropy at freeze-outU.A.Wiedemann, PRC 57 (1998) 266 • 3-dimensional correlation functions calculated separately in 8 bins of pair - RP • Assuming pure geometric effect one should expect such dependence of HBT radii • RP resolution influence on HBT vs. RP results corrected based on MC study Reaction plane determined via elliptic flow, range between -/2 and /2
HBT vs. RP – CERES 158 AGev Datauncorrected for RP resolution • Centrality 15-25% • HBT vs. RP parameterized by
Azimuthal pion source eccentricity vs. event centrality From geometrical expectation • Rout,22 suggest out-of-plane elongation • Rside,22 and Rlong,22 unexpected • Rout-side,22 consistent with Rout,22
Excitation function of source anisotropy • Common centrality • 15-25% • Source eccentricity • ≈ R2side,2 / R2side,0 • At SPS = 0.043±0.023
Discussion and Comments • Good agreement between new and old CERES results as well NA49 for 158 and 80 AGeV, analysis for 40 AGeV in progress • azimuthal anisotropy of Rout as expected, however • no significant azimuthal anisotropy of the source observed by Rside radii. Possible softening by bayron-meson mixed state. • Possible source of Rlong oscillation - initial collision condition • More azimuthal anisotropy studies are need (RHIC low energy runs)
More from SPS • Hydro calculation for SPS – works well for flow and pt-spectra but fails to reproduce HBT radii, see presentation form D.Miśkowiec (WPCF 2007) • 3D source imaging technique applied to SPS/NA49 data arXiv:0807.4892
CERES/NA45 Setup System Pb+Au @ 17.2, 12.3, 8.8 GeV Target13/8 gold disks (diameter 600 m, thickness 25 m) SiDC1+2Vertex reconstruction RICH1+2Electron ID TPCCharge particle ID Acceptance 2.03 < < 2.65 Momentum resolutionp/p=2% 1%·p/GeV Energy loss resolution (dE/dx)/(dE/dx)=10% Radial drift field (1/r), azimuthal deflection
Data set - Pb+Au @ 158 AGeV Available statistics • 30 M events with centrality 7% • 2 M events with centrality 20 % • 500 k minimum bias events Track cuts • good fit quality from tracking • high number of fitted hits (long track) • matching between TPC and SD < 2 • partial PID via dE/dx vs. momentum
Sailor Cowboy Data set – Pair cuts Different minimum opening cuts needed for the two topologies: Sailor Cowboy
Coulomb interaction Schrödinger equation describing particle in the Coulomb field is wave function squared Coulomb correlation function: square of the non-relativistic wave function averaged over finite Gaussian source.
Previous HBT radii resultsanalysis by Heinz Tilsner and Harald Appelshäuser Nucl. Phys. A714 (2003) 124
Effect of the Coulomb correction attenuated by λ full strength
Effect of the Coulomb correction attenuated by λ full strength
Correction for momentum resolution • example: highest p bin (the largest correction) • determined by Monte Carlo • lines: various attempts to parameterized effect • correction applied to the radii obtained from the fit
Extracting source parameters System size, transverse flow velocity Chapman, Phys. Rev C52(1995) 2694 /GEOM 0-2.5 % System lifetime Sinyukov, Z. Phys. C39(1998) 69, Herrmann, Bertsh, Phys. Rev. C51(1995)328 /GEOM 15-25 % /GEOM ~ 17.5 % assuming Tf=0.12 GeV
Pair acceptance - – standard HBT analysis midrapidity = 2.91
Centrality dependence of f , RG and f2/Tf 1.3 < Y<2.8 fix Tf=0.12 GeV
Fitting the HBT correlation functions • Standard Gaussian fit used • Maximum likelihood assuming Poison distribution • Coulomb included in the fit, calculated for a similar source size and attenuated by • where • N is a normalization and (k) is a correlation strength • with i,j = out, side, long • Fcoul(q) is a Coulomb correlation function
HBT radii vs. k┴ for 158 AGeV Comparison to CERES previous results centrality 0-5% Nucl. Phys. A714 (2003) 124 Comparison to NA49 preliminary results centrality 0-7.5% PRC 77, 064908 (2008)