Download

1 / 75
770 likes | 963 Views
Demographic Environment selected tables Magister Manajemen UGM. Dr. Anna Marie Wattie, MA Staf Pengajar Jurusan Antropologi, Fakultas Ilmu Budaya dan Magister Studi Kebijakan UGM Staf Peneliti Pusat Studi Kependudukan dan Kebijakan UGM. What is demography?.

E N D
Demographic Environmentselected tablesMagister Manajemen UGM Dr. Anna Marie Wattie, MA Staf Pengajar Jurusan Antropologi, Fakultas Ilmu Budaya dan Magister Studi Kebijakan UGM Staf Peneliti Pusat Studi Kependudukan dan Kebijakan UGM
What is demography? • Demography is a broad social science discipline concerned with the study of human populations. Demographers deal with the collection, presentation and analysis of data relating to the basic life-cycle events and experiences of people: birth, marriage, divorce, household and family formation, employment, ageing, migration and death
Jumlah Penduduk menurut ProvinsiNumber of Population by ProvinceSumber/Source:SP (1971, 1980, 1990, 2000) dan Supas (1995, 2005
Jumlah Penduduk menurut ProvinsiNumber of Population by ProvinceSumber/Source:SP (1971, 1980, 1990, 2000) dan Supas (1995, 2005
Jumlah Penduduk menurut ProvinsiNumber of Population by ProvinceSumber/Source:SP (1971, 1980, 1990, 2000) dan Supas (1995, 2005
Number and population Density by Island and Provinces in 2000
Number and population Density by Island and Provinces in 2000
Number and population Density by Island and Provinces in 2000
Number and population Density by Island and Provinces in 2000 Source: BPS, Welfare Indicators, Jakarta, p.5
Distribusi Persentase Luas dan Penduduk menurut Pulau Percentage Distribution of Area and Population by IslandSumber/Source: BPS, berbagai publikasi
Kepadatan Penduduk per Km2 menurut ProvinsiPopulation Density per Km2 by ProvinceSumber / Source : Sensus Penduduk (1971, 1980, 1990, 2000) dan Supas 2005
Kepadatan Penduduk per Km2 menurut ProvinsiPopulation Density per Km2 by ProvinceSumber / Source : Sensus Penduduk (1971, 1980, 1990, 2000) dan Supas 2005
Kepadatan Penduduk per Km2 menurut ProvinsiPopulation Density per Km2 by ProvinceSumber / Source : Sensus Penduduk (1971, 1980, 1990, 2000) dan Supas 2005
Population Growth Rate The average annual percent change in the population, resulting from a surplus (or deficit) of births over deaths and the balance of migrants entering and leaving a country. The rate may be positive or negative. The growth rate is a factor in determining how great a burden would be imposed on a country by the changing needs of its people for infrastructure (e.g., schools, hospitals, housing, roads), resources (e.g., food, water, electricity), and jobs. Rapid population growth can be seen as threatening by neighboring countries. Pertumbuhan penduduk adalah perubahan jumlah penduduk di suatu wilayah tertentu pada waktu tertentu dibandingkan waktu sebelumnya. Misalnya pertumbuhan penduduk Indonesia dari tahun 1995 ke tahun 2000 adalah perubahan jumlah penduduk Indonesia dari tahun 1995 sampai 2000.
Laju Pertumbuhan Penduduk per Tahun menurut ProvinsiAnnual Rate of Growth by ProvinceSumber/Source : Sensus penduduk (1971,1980,1990,2000) dan Supas 2005
Laju Pertumbuhan Penduduk per Tahun menurut ProvinsiAnnual Rate of Growth by ProvinceSumber/Source : Sensus penduduk (1971,1980,1990,2000) dan Supas 2005
Laju Pertumbuhan Penduduk per Tahun menurut ProvinsiAnnual Rate of Growth by ProvinceSumber/Source : Sensus penduduk (1971,1980,1990,2000) dan Supas 2005
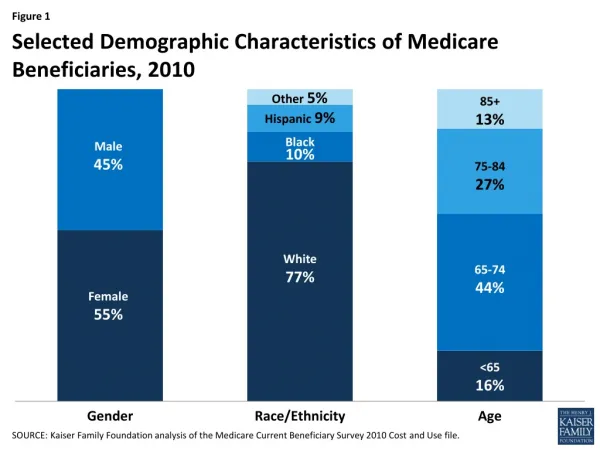
Sex ratio This entry includes the number of males for each female in five age groups - at birth, under 15 years, 15-64 years, 65 years and over, and for the total population. Sex ratio at birth has recently emerged as an indicator of certain kinds of sex discrimination in some countries. For instance, high sex ratios at birth in some Asian countries are now attributed to sex-selective abortion and infanticide due to a strong preference for sons. This will affect future marriage patterns and fertility patterns. Eventually it could cause unrest among young adult males who are unable to find partners. Rasio Jenis Kelamin (RJK) adalah perbandingan jumlah penduduk laki-laki dengan jumlah penduduk perempuan per 100 penduduk perempuan. Data mengenai rasio jenis kelamin berguna untuk pengembangan perencanaan pembangunan yang berwawasan gender, terutama yang berkaitan dengan perimbangan pembangunan laki-laki dan perempuan secara adil.
Rasio Jenis Kelamin Penduduk menurut ProvinsiSex Ratio by ProvinceSumber/Source : Sensus Penduduk (1971,1980,1990,2000) dan Supas 2005
Rasio Jenis Kelamin Penduduk menurut ProvinsiSex Ratio by ProvinceSumber/Source : Sensus Penduduk (1971,1980,1990,2000) dan Supas 2005
Rasio Jenis Kelamin Penduduk menurut ProvinsiSex Ratio by ProvinceSumber/Source : Sensus Penduduk (1971,1980,1990,2000) dan Supas 2005
Total Fertility Rate This entry gives a figure for the average number of children that would be born per woman if all women lived to the end of their childbearing years and bore children according to a given fertility rate at each age. The total fertility rate is a more direct measure of the level of fertility than the crude birth rate, since it refers to births per woman. This indicator shows the potential for population growth in the country. High rates will also place some limits on the labor force participation rates for women. Large numbers of children born to women indicate large family sizes that might limit the ability of the families to feed and educate their children Angka Fertilitas Total (Total Fertility Rate/TFR) adalah rata-rata anak yang dilahirkan seorang wanita selama masa usia suburnya.TFR merupakan gambaran mengenai rata-rata jumlah anak yang dilahirkan seorang perempuan dari usia 15 sampai 49 tahun. Perbandingan angka TFR antar negara atau antar daerah dapat menunjukkan keberhasilan daerah dalam melaksanakan pembangunan sosial ekonominya. Angka TFR yang tinggi dapat merupakan cerminan rata-rata usia kawin yang rendah, tingkat pendidikan yang rendah terutama perempuannya, tingkat sosial ekonomi rendah atau tingkat kemiskinan yang tinggi.
Trend Angka Fertilitas Total menurut ProvinsiTend of Total Fertility Rate (TFR) by Province
Trend Angka Fertilitas Total menurut ProvinsiTend of Total Fertility Rate (TFR) by Province
Trend Angka Fertilitas Total menurut ProvinsiTend of Total Fertility Rate (TFR) by Province
Infant Mortality Rate This entry gives the number of deaths of infants under one year old in a given year per 1,000 live births in the same year; included is the total death rate, and deaths by sex, male and female. This rate is often used as an indicator of the level of health in a country. Kematian bayi adalah kematian yang terjadi antara saat setelah bayi lahir sampai bayi belum berusia tepat satu tahun. Banyak faktor yang dikaitkan dengan kematian bayi. Secara garis besar, dari sisi penyebabnya, kematian bayi ada dua macam yaitu endogen dan eksogen. Kematian bayi endogen atau yang umum disebut dengan kematian neonatal; adalah kematian bayi yang terjadi pada bulan pertama setelah dilahirkan, dan umumnya disebabkan oleh faktor-faktor yang dibawa anak sejak lahir, yang diperoleh dari orang tuanya pada saat konsepsi atau didapat selama kehamilan. Kematian bayi eksogen atau kematian post neo-natal, adalah kematian bayi yang terjadi setelah usia satu bulan sampai menjelang usia satu tahun yang disebabkan oleh faktor-faktor yang bertalian dengan pengaruh lingkungan luar
Angka Kematian Bayi (AKB) menurut Provinsi, Kabupaten/Kota, dan Jenis KelaminInfant Mortality Rates by Province, District and SexSumber/Source :SP 2000
Angka Kematian Bayi (AKB) menurut Provinsi, Kabupaten/Kota, dan Jenis KelaminInfant Mortality Rates by Province, District and SexSumber/Source :SP 2000
Angka Kematian Bayi (AKB) menurut Provinsi, Kabupaten/Kota, dan Jenis KelaminInfant Mortality Rates by Province, District and SexSumber/Source :SP 2000
Rata-rata Umur Perkawinan Perempuan menurut Daerah dan ProvinsiSingulate Mean Age at Marriage (SMAM)of Female by Area and ProvinceSumber Source : SP 1971, 1990, 2000
Rata-rata Umur Perkawinan Perempuan menurut Daerah dan ProvinsiSingulate Mean Age at Marriage (SMAM)of Female by Area and ProvinceSumber Source : SP 1971, 1990, 2000
Rata-rata Umur Perkawinan Perempuan menurut Daerah dan ProvinsiSingulate Mean Age at Marriage (SMAM)of Female by Area and ProvinceSumber Source : SP 1971, 1990, 2000
Persentase Wanita Usia 15-49 tahun menurut Alat/Cara KB yang sedang Digunakan, 2005Percentage of Women Aged 15-49 year who Currently Use of Contraceptive by Method, 2005
Persentase Wanita Usia 15-49 tahun menurut Alat/Cara KB yang sedang Digunakan, 2005Percentage of Women Aged 15-49 year who Currently Use of Contraceptive by Method, 2005
Persentase Wanita Usia 15-49 tahun menurut Alat/Cara KB yang sedang Digunakan, 2005Percentage of Women Aged 15-49 year who Currently Use of Contraceptive by Method, 2005
Persentase Wanita Usia 15-49 tahun menurut Alat/Cara KB yang sedang Digunakan, 2005Percentage of Women Aged 15-49 year who Currently Use of Contraceptive by Method, 2005
Net migration rate This entry includes the figure for the difference between the number of persons entering and leaving a country during the year per 1,000 persons (based on midyear population). An excess of persons entering the country is referred to as net immigration (e.g., 3.56 migrants/1,000 population); an excess of persons leaving the country as net emigration (e.g., -9.26 migrants/1,000 population). The net migration rate indicates the contribution of migration to the overall level of population change. High levels of migration can cause problems such as increasing unemployment and potential ethnic strife (if people are coming in) or a reduction in the labor force, perhaps in certain key sectors (if people are leaving).
Migrasi Seumur Hidup menurut Provinsi Life Time Migration by ProvinceSumber Source : Sensus Penduduk 1971, 1980, 1990, dan 2000
Migrasi Seumur Hidup menurut Provinsi Life Time Migration by ProvinceSumber Source : Sensus Penduduk 1971, 1980, 1990, dan 2000
Migrasi Seumur Hidup menurut Provinsi Life Time Migration by ProvinceSumber Source : Sensus Penduduk 1971, 1980, 1990, dan 2000
Educational Attainment The highest educational level completed in the highest grade/class, at a public or private school, identified by the receipt of a diploma or a letter of completion/certificate
Education Structure of Population by Province in Year 1990 and 2003