Download
1 / 30
300 likes | 486 Views
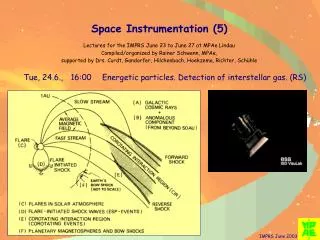
Computer Simulations of Alfvén Eigenmodes destabilized by Energetic Particles. Y. Todo (National Institute for Fusion Science, Japan) 6th Japan-Korea Workshop on Theory and Simulation of Magnetic Fusion Plasmas (NIFS, Toki, July 28-29, 2011). many thanks to

E N D
Computer Simulations of Alfvén Eigenmodes destabilized by Energetic Particles Y. Todo (National Institute for Fusion Science, Japan) 6th Japan-Korea Workshop on Theory and Simulation of Magnetic Fusion Plasmas (NIFS, Toki, July 28-29, 2011)
many thanks to • N. Nakajima, A. Ito, T.-H. Watanabe, M. Osakabe, K. Toi, M. Isobe (NIFS) • H. Wang [Univ. Advanced Studies (Sokendai)] • A. Bierwage, M. Yagi, N. Aiba, K. Shinohara, M. Ishikawa, M. Takechi (JAEA) • S. Yamamoto (Kyoto Univ.) • H. L. Berk, B. N. Breizman (IFS, Univ. Texas) • D. A. Spong (ORNL) • C. C. Kim (Univ. Washington) • ITPA Energetic Particle Topical Group
Outline • Simulation model • EP + MHD hybrid simulation model • Simulation of AE bursts • Reduced simulation • Hybrid simulation with nonlinear MHD effects
EP current density Energetic ion current density without ExB drift: parallel + curvature drift + grad-B drift magnetization current
Example of TAE mode (1) n=3 mode, Ej MEGA results on ITPA linear code benchmark case [JET shot 77788 (t=44.985s) P. Lauber]
Example of TAE mode (2): in LHD n=1 mode rvr MEGA results on LHD shot #47645
Vlasov-MHD simulation of AE evolution [Y. Todo et al., Phys. Plasmas 2, 2711 (1995)] • Linear growth and saturation of AE instability • Amplitude oscillation takes place after the saturation
Particle trapping by the Alfvén eigenmode saturates the instability Time evolution of energetic-ion distribution in a poloidal plane AE spatial profile
Simulation of ITER weakly reversed shear plasma • Low-n (n=2-5) toroidal Alfven eigenmodes (TAE) were found to be unstable. • Saturation level: dB/B~10-3 • Redistribution of a particle pressure is 5% of the central value. • An extended MHD model was employed. Further development is under way. Toroidal electric field of the n=3 TAE. [Y. Todo, J. Plasma Phys. 72, 817 (2006)]
Outline • Simulation model • EP + MHD hybrid simulation model • Simulation of AE bursts • Reduced simulation • Hybrid simulation with nonlinear MHD effects
Alfvén Eigenmode Bursts Results from a TFTR experiment [K. L. Wong et al., Phys. Rev. Lett. 66, 1874 (1991).] Neutron emission: nuclear reaction of thermal D and energetic beam D -> drop in neutron emission = energetic-ion loss Mirnov coil signal: magnetic field fluctuation -> Alfvén eigenmode bursts • Alfvén eigenmode bursts take place with a roughly constant time interval. • 5-7% of energetic beam ions are lost at each burst.
Time evolution of TAE mode amplitude and stored beam energy Stored beam energy is reduced to 40% of the classically expected level (right). Synchronization of multiple modes due to resonance overlap (left).
The losses balances with the beam injection when the amplitude of the outermost mode reaches to 6x10⁻³
Poincaré plot of energetic-ion orbits in the presence of an AE with constant amplitude (dB/B=2×10-3 at the peak) • An island structure is formed in the phase space. • This is the region of particles trapped by the AE.
Poincaré plots when particle loss balances the injection: resonance overlap of multiple modes takes place
Reduced Simulation of Alfvén Eigenmode Bursts[Todo, Berk, Breizman, PoP 10, 2888 (2003)] • Nonlinear simulation in an open system: NBI, collisions, losses • The TAE bursts in a TFTR experiment [Wong et al. PRL 66, 1874 (1991)] were reproduced quantitatively. Store of energetic ions Destabilization of AEs Transport and loss of energetic ions Stabilization of AEs Time evolution of energetic-ion density profile.
Summary of the reduced simulation of AE bursts • consistent with the experiment: • synchronization of multiple TAE modes • drop in stored beam energy at each burst • burst time interval • inconsistent in saturation amplitude • simulation: dB/B~2×10-2 • inferred from the plasma displacement at the edge region [Durst et al., PoF B 4, 3707 (1992)]: dB/B~10-3
Outline • Simulation model • EP + MHD hybrid simulation model • Simulation of AE bursts • Reduced simulation • Hybrid simulation with nonlinear MHD effects
Comparison between linear and NL MHD runs (jh’ is restricted to n=4) EP effects The viscosity and resistivity are =n=2×10⁻⁷vAR0 and =2×10-70vAR0 . The numbers of grid points are (128, 64, 128) for (R, φ, z).The number of marker particles is 5.2x10⁵.
Simulation with source, loss, collisions and NL MHD • Time dependent f0is implemented in MEGA • particle loss (at r/a=0.8 for the present runs) • for marker particles to excurse outside the loss boundary and return back to the inside • phase space inside the loss boundary is well filled with the marker particles • particle weight is set to be 0 during r/a>0.8 • if the simulation box is extended to include the vacuum region, the loss boundary can be set at more realistic location
Physics condition • similar to the reduced simulation of TAE bursts at the TFTR experiment • parameters • a=0.75m, R0=2.4m, B0=1T, q(r)=1.2+1.8(r/a)2 • NBI power: 10MW • beam injection energy: 110keV (deuterium) • vb=1.1vA • parallel injection (v///v=-1 or 1) • slowing down time: 100ms • no pitch angle scattering
Evolution of stored beam energy and TAE amplitude n=2 TAE n=3 TAE • Energetic particle losses due to TAE bursts. • Synchronization of multiple TAEs. • n=h/m0=c=2×10-7vAR0 • Amplitude is measured at the mode peak locations.
NL MHD effects • reduction of saturation level • suppression of beam ion loss • n=h/m0=c=10-7vAR0 stored beam energy n=2 TAE peak amplitude NL MHD Linear MHD
Effects of dissipation coefficients • Higher dissipation bursts • n=h/m0=c=10-7vAR0 • 3×10⁻⁷vAR0 • 5×10⁻⁷vAR0 n=2 TAE peak amplitude stored beam energy
Comparison of EP pressure profiles for different dissipation • t=20.0 ms • EP pressure profiles are very similar among the different dissipation coefficients. • Higher dissipation leads to slightly higher EP pressure.
Comparison of EP pressure profiles before and after a burst • n=h/m0=c=5×10-7vAR0 • EP transport and losses during the TAE burst lead to a reduction in pressure profile.
Summary of TAE burst simulation with NL MHD effects • TAE bursts are successfully simulated with NL MHD effects using time-dependent f0. • saturation amplitude of the dominant harmonic with significant beam ion loss: δB/B~5×10-3 • NL MHD effects • reduction of saturation level • suppression of beam ion loss • Effects of dissipation • Low dissipation: statistically steady state • High dissipation: bursts • Higher dissipation leads to higher stored beam energy