A Stack Frame
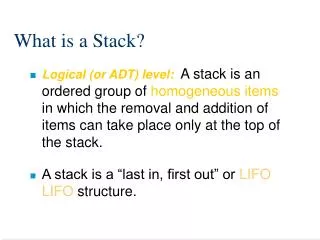
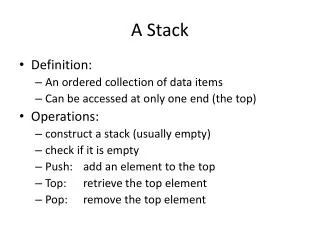
CAP6135: Malware and Software Vulnerability Analysis Buffer Overflow : Example of Using GDB to Check Stack Memory Cliff Zou Spring 2011. A Stack Frame. Parameters Return Address Calling Stack Pointer Local Variables. BP. SP+ offset. SP. Addresses. 00000000.

A Stack Frame
E N D
Presentation Transcript
CAP6135: Malware and Software Vulnerability Analysis Buffer Overflow : Example of Using GDB to Check Stack MemoryCliff ZouSpring 2011
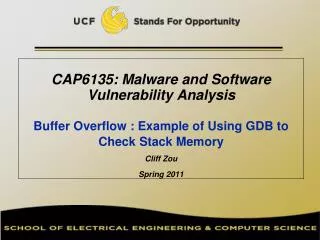
A Stack Frame Parameters Return Address Calling Stack Pointer Local Variables BP SP+offset SP Addresses 00000000 SP: stack pointer BP: base/frame pointer Calling stack pointer: previous function’s SP
Using GDB to Check Stack • GDB tutorial: • http://gemma.apple.com/mac/library/documentation/DeveloperTools/gdb/gdb/gdb_7.html • http://www.yolinux.com/TUTORIALS/GDB-Commands.html#GDB_COMMAND_LINE_ARGS • When compile the c code, use “gcc –g …..” so that Gdb can match source code line number with code • Some knowledge: http://en.wikipedia.org/wiki/X86_assembly_language • Register eip: instruction pointer, the current position of next executable instruction • Register ebp: stack pointer, the top of the current stack, used for addressing local variable
Related Gdb Commands: • List: list the source code and each execution’s corresponding line number • Break linenumber: set breakpoint at the linenumber • Run argv: run the execution code with the parameter argv • Next: execute the next line of code • Backtrace: show trace of all function calls in stack • Info frame: List address, language, address of arguments/local variables and which registers were saved in frame. • This will show where the return address is saved • Return address is in Register EIP • Calling stack pointer is in Register EBP • x &variable: show the address and value of a local variable (in hex format) • x address: print binary representation of 4 bytes of memory pointed to by address.
Example of Using GDB #include <stdio.h> void foo(char * input){ int a1=11; int a2=22; char buf[7]; strcpy(buf, input); } void main(int argc, char **argv){ foo(argv[1]); } Question: What does the stack look like before strcpy()?
czou@eustis:~/buffer-code$ setarch i686 –R gdb ./gdb-example (gdb) list 1 #include <stdio.h> 2 void foo(char * input){ 3 int a1=11; 4 int a2=22; 5 char buf[7]; 6 strcpy(buf, input); 7 } 8 void main(int argc, char **argv){ 9 foo(argv[1]); 10 } (gdb) break 6 Breakpoint 1 at 0x80483e9: file gdb-example.c, line 6. (gdb) run Starting program: /home/czou/buffer-code/gdb-example Breakpoint 1, foo (input=0x0) at gdb-example.c:6 6 strcpy(buf, input); (gdb)
(gdb) info frame Stack level 0, frame at 0xbffff7d0: eip = 0x80483e9 in foo (gdb-example.c:6); saved eip 0x804842f called by frame at 0xbffff7e0 source language c. Arglist at 0xbffff7c8, args: input=0x0 Locals at 0xbffff7c8, Previous frame's sp is 0xbffff7d0 Saved registers: ebp at 0xbffff7c8, eip at 0xbffff7cc (gdb) x &a1 0xbffff7b8: 0x0000000b (gdb) x &a2 0xbffff7b4: 0x00000016 (gdb) x buf 0xbffff7bc: 0x080482ec (gdb) x 0xbffff7b4 0xbffff7b4: 0x00000016
Several Tips on Project 1 • Be sure to use the Makefile to generate executable of both exploit program and target program • Be sure to use “setarch i686 -R” in front of every execution, including both Gdb and ./exploit • You can use “break foo” to set breakpoint upon entering foo() function. • Fill the shell executable code (in the string array shellcode[]) byte-by-byte into the buffer for your modified return address to execute.
NOPs • Most CPUs have a No-Operation instruction – it does nothing but advance the instruction pointer. • Usually we can put a bunch of these ahead of our program (in the string). • As long as the new return-address points to a NOP we are OK.
Using NOPs Real program (exec /bin/ls or whatever) new return address Can point anywhere in here nop instructions
Estimating the stack size • We can also guess at the location of the return address relative to the overflowed buffer. • Put in a bunch of new return addresses!
Estimating the Location new return address new return address new return address new return address new return address new return address Real program nop instructions