Download
1 / 12
120 likes | 256 Views
MJO Data. Current MJO Phase and Past 40 days Current MJO Phase and Past 90 Days The MJO time last year Archives. MJO.

E N D
MJO Data • Current MJO Phase and Past 40 days • Current MJO Phase and Past 90 Days • The MJO time last year • Archives
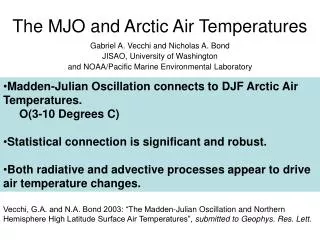
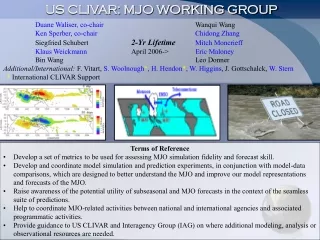
MJO • To make a long story short, it has been proven by many credible scientists that the MJO wave in the Indian Ocean has a strong impact on upper latitude features. The most impacted region of the globe is the North Pacific, which makes sense given the location around the equator where the MJO is located, and the waves impact on ENSO. -SSC-
MJO and Teleconnections (January 2007) JANUARY 4-9 Pattern starts changing, but the lagged effects of Phases 3-4 give the entire US a major blowtorch during this time period. Deadly +EPO/+NAO combo.
MJO and Teleconnections (January 2007) JANUARY 10-15 MJO races through Phases 5-6 which support a La Nina type look to the Northern Hemisphere as shown by the SLP images below.... Cold air moves south from Alaska and into in western Canada. Cold air will flood into the US through the NW and Upper Midwest during this time. Models are in strong agreement with this. This will prove to be the coldest period of the winter for both regions. Classic La Nina look.
MJO and Teleconnections (Jan 2007) JANUARY 16-25 MJO enters Phases 7-8 and slows down. As shown below, Phases 6-7 correlate with a ridge in the GOA and over AK (-EPO). Phases 6-7-8 strongly correlate with a low south of the Aleutians (+PNA). The effects of this anomaly are a trough in the east with a ridge in the west. As we get into the Jan 16-25 period, our pattern should resemble this with all of the cold air moving east of the Rockies. This should be coldest part of the winter for I-95 although the initial push of cold air may not enter the region until Jan 17-18.
MJO and Teleconnections (January 2007) JANUARY 25 to FEB 3 MJO goes back into phases 1-2... Pacific Jet starts up again, and Pacific air floods the northern 1/2 of the country just like Dec 6-12. The SE should remain cool.
MJO Waves • Supporting this idea are MJO forecast models showing that the current wave is progged to become the slowest during strengthening phases (7 and 8) toward the end of the month... The model is also showing the strength of the wave persisting through day 40 which agrees with the warm SST idea.