Equilibrium and Disequilibrium
450 likes | 784 Views
Equilibrium and Disequilibrium. Mr. Messere Gr. 12 Economics CIA 4U1. Outline. I. Changes in Equilibrium A. Change in Demand B. Change in Supply C. Change in Both Demand and Supply II. Market Disequilibrium A. Price Floors Price Ceilings Commodity Agreements. Market Dynamics.

Equilibrium and Disequilibrium
E N D
Presentation Transcript
Equilibrium and Disequilibrium Mr. Messere Gr. 12 Economics CIA 4U1
Outline I. Changes in Equilibrium A. Change in Demand B. Change in Supply C. Change in Both Demand and Supply II. Market Disequilibrium A. Price Floors • Price Ceilings • Commodity Agreements
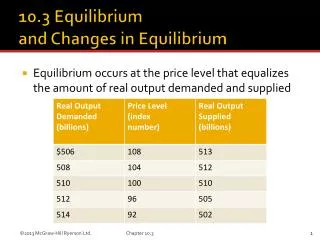
Market Dynamics • Equilibrium - where quantity demanded equals quantity supplied • Equilibrium Price (P*) - price where equilibrium occurs. • If price above equilibrium, then surplus occurs • If price below equilibrium, then shortage arises
Equilibrium/Surplus/Shortage P Surplus S P1 E P* P2 D Shortage Q 0 Q*
Equilibrium in the Market What Occurs at Equilibrium? • Demand Side - those who get the good are those willing and able (effective demand) to pay the P*. • Supply Side - only those firms which are able to produce at or below the cost of P* will remain in business.
Changes in Equilibrium • Remember that Supply and Demand are drawn under the ceterisparibus assumption. • Any factors which cause Supply and/or Demand to change will affect equilibrium price and quantity.
Change in Demand • Demand will change for any of the non-price determinants examined previously: • Tastes/Preferences • Income • Price of Substitute & Complementary goods • Expectations • Population Ceteris paribus, let’s say the demand for CDs increased due to an increase in income. How would this affect market equilibrium price & quantity of CDs?
Increase in Demand P SCDs DCDs Q 0
Increase in Demand P SCDs E’ P*’ P* E D’ DCDs Q 0 Q* Q*’
Change in Supply • Supply will change for any of the the non-price determinants examined previously: - Costs of Production – Input costs / taxes & subsidies - Technology - Nature and the environment • Number of producers • Complements & substitutes in production Ceteris paribus, let’s say that the government lowers taxes on CDs. How would this affect the market equilibrium price & quantity of CDs?
Increase in Supply P SCDs DCDs Q 0
Increase in Supply P SCDs S’ E P* P*’ E’ DCDs Q 0 Q* Q*’
Changes in Demand and Supply To determine the impact of both supply and demand changing: • First examine what happens to equilibrium price and quantity when just demand shifts. • Second, examine what happens to equilibrium price and quantity when just supply changes • Finally, add the two effects together.
Changes in Demand and Supply General Results: • When supply and demand move in the same direction • Equilibrium price is indeterminate • When supply and demand move in opposite directions • Equilibrium quantity is indeterminate
Supply & Demand Move in the Same Direction Assume ceteris paribus: Suppose that the barbecue season is at its peak. Also, the price of cattle decreases by 10% during this time. How would this affect the market equilibrium price & quantity of steak?
Supply & Demand Move in the Same Direction P SSteak S’ E1 P1 P? E E2 P* D’ DSteak Q 0 Q* Q1 Q2
Final Equilibrium Quantity & Price when Demand & Supply move in the Same Direction Since it is barbecue season, consumer preference for steak has increased, thus causing demand to increase from D to D’. This temporarily pulls up price and increases quantity demanded to P1 and Q1respectively. At the intermediate equilibrium level, E1, supply then increases from S to S’ as a result of lower cattle prices (a fall in the price of an input) which pushes the final market equilibrium quantity to E2 where the final equilibrium quantity is Q2 and equilibrium price is indeterminate.
Supply & Demand Move in Opposite Directions Assume ceteris paribus: Suppose that the price of lemons falls and lemon is considered an essential ingredient in preparing great tasting spinach. At the same time, many spinach farmers also reduce the amount of land used to produce spinach. How would this affect the market equilibrium price & quantity of spinach?
Supply & Demand Move in the Opposite Directions S’ P SSpinach E2 P2 P1 E1 P* E D’ Q? DSpinach Q 0 Q* Q1
Final Equilibrium Quantity & Price when Demand & Supply move in Opposite Directions As a result of the price of lemons falling (a complimentary good) the demand for spinach increases from D to D’ and temporarily raises the price from P* to P1 and quantity from Q* to Q1. At the intermediate equilibrium level, E1, supply then decreases from S to S’ because there are fewer farmers growing spinach which pushes the final market equilibrium quantity to E2 where the final equilibrium price is P2 and equilibrium quantity is indeterminate.
The Role of Prices • Convey information • When the price of a Maple Leaf ticket increased from $120 last season to $150 this season (on average), it told us something about the popularity of the Maple Leafs • Rationiong device • The price is what determines who can have the good
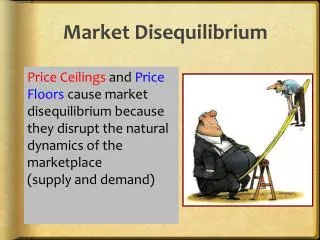
Market Disequilibrium • Is it possible for the price and quantity to NOT be in equilibrium? • Yes - While the invisible hand may move price towards equilibrium, price controls tend to generate disequilibrium in the marketplace
Price Controls There are two types of price controls: 1) Price Ceilings 2) Price Floors
Price Ceilings • Price Ceiling - sets a maximum price that is allowed by law. • Result of Price Ceiling: • Stay at a permanent shortage situation • Note that a price ceiling can be any price the government chooses. It is, however only effective if it is below the equilibrium price
Price Ceiling • Example of Price Ceiling • Rent controlled apartments • In New York City, San Francisco, Boston, and other cities the city or state determines the maximum amount that can be charged for rent on many apartments. • A maximum price is a price ceiling
Rent Controlled Apartments P S D Q 0
Rent Controlled Apartments P S P* D Q 0 Q*
Amount of Shortage Rent Controlled Apartments P S P* Pceiling D Q 0 Qs Q* Qd
Winners and Losers Who gains and loses with price ceilings? 1. Benefit - those who get rent controlled apartments 2. Loses - those who can’t find apartments due to the shortage. 3. Loses - landlords who must accept lower rent.
Price Floors • Price Floor - sets a minimum price that is allowed by law. • Result of Price Floor • Stay at a permanent surplus situation • Note that a price floor can be set at any price, but is only effective if it is above the equilibrium price
Price Floors • Example of Price Floor • Minimum Wage Legislation • The minimum wage is a lowest price the government will allow firms to pay for labor. • A minimum price is a price floor
Price Floors • When we look at the labor market it is similar to other supply and demand diagrams except for the labels. • L - quantity of workers • w - wages (the price we pay workers) • It is also different because the suppliers of labor are households, not firms, and the demanders of labor are firms, not households
Minimum Wage Legislation Wage S D # of Workers 0
Minimum Wage Legislation Wage S w* D # of Workers 0 L*
Minimum Wage Legislation Amount of Unemployed Workers Wage S wfloor w* D # of Workers 0 Ld L* Ls
Winners and Losers Who gains and loses with price floors? 1. Benefit - those who get higher wages 2. Loses - those who can’t find jobs at the higher wage 3. Loses - firms who must pay higher wages.
Commodity Agreements • Market instability may arise due to: • Fluctuating prices due to changing market conditions • Changing prices due to changes in exchange rates • Changes in foreign government protectionist measures • Producers of commodities (eg. coffee, sugar, grains, tin) may cooperate to stabilize the market • eg. prices kept from falling below certain level
Production Quota System • An agreement by producers to limit the amount supplied to the market place & thus influence price • Individual cartel members produce portion of output according to their quota
Production Quota System S2 Price S1 P2 P1 D Q2 Q1
Buffer Stock System • Group of producers (with support of gov’t) set a target price or price band (price floor & ceiling) • If market conditions lead to • Shortage (price above target price), buffer stock authority will sell off previously acquired stocks • Surplus (price falls below target price), buffer stock authority will agree to purchase surplus at intervention price
Buffer Stock System S1 S2 S3 S4 S5 Price P4 P3 Shortage Target Band P2 P1 Surplus D Q1 Q2 Q3 Q4 Q5
Buffer Stock System - Considerations • Surplus can be disposed of in several ways: • Stored for future use • Opportunity cost of storage facilities can be prohibitive for producers • Destruction of commodity • If food, normative issue arises in light of global poverty & hunger • Selling to other countries • If dumped in another country (priced below foreigners’ own prices in domestic market) can undermine domestic producers in countries where goods sold • Provision as overseas assistance • Food aid could lead to dependency culture
Further Practice • Use the last question page to complete the following. • For each question indicate whether: • - price increased, decreased or it was indeterminate (impossible to determine) • - quantity increased, decreased or it was indeterminate (impossible to determine) Practice Test