Download
1 / 17
170 likes | 240 Views
CV Risk and Lipids in Asia: Epidemiology. The Burden of CVD in Asia: Stroke Deaths by Country, 2002. WHO CVD Atlas. 2002. WHO Stroke Atlas. 2002. The Burden of CVD in Asia: CHD Deaths by Country, 2002. WHO CVD Atlas. 2002. WHO Stroke Atlas. 2002.

E N D
The Burden of CVD in Asia: Stroke Deathsby Country, 2002 WHO CVD Atlas. 2002. WHO Stroke Atlas. 2002.
The Burden of CVD in Asia: CHD Deaths by Country, 2002 WHO CVD Atlas. 2002. WHO Stroke Atlas. 2002.
Age-Standardized Stroke and CHD DeathRates by Country, 2002 Ueshima H et al. Circulation. 2008;118:2702-2709.
Stroke Type in China Shanghai Beijing Ischemic ICH SAH Undet ICH = Intracranial hemorrhage, SAH = subarachnoid hemorrhage, undet = undetermined Jiang et al. Stroke. 2006;37:63-68. Zhao et al. Stroke. 2008;39:1668-1674. • Sino-MONICA-Beijing project indicate from 1984 to 2004 • the incidence of hemorrhagic stroke declined by 1.7% annually • the incidence of ischemic stroke increased by 8.7% annually • Stroke subtypes in urban areas
Projected Stroke and CHD Increase to2030: Effect of Population Aging andRisk-Factor Changes in China Moran et al. Circ Cardiovasc Qual Outcomes. 2010;3;243-252.
Burden of Diabetes in Asia No. with Diabetes Deaths Attributable to Diabetes, Ages 20-79 Years 600,000 40 35 Age group, y 500,000 MenWomen 20-39 40-59 60-79 30 400,000 25 300,000 20 No. of Deaths 15 No. With Diabetes (millions) 200,000 10 100,000 5 0 0 Africa Africa EMME EMME Europe Europe NorthAmerica NorthAmerica SACA SACA SEA SEA WesternPacific WesternPacific Chan JC et al . JAMA. 2009;301:2129-2140.
High Cumulative Incidence of Stroke inAsians With Type 2 Diabetes Major Cerebrovascular Events 12 P < 0.0001 10 8 6 Cumulative Incidence 4 2 Asia Eastern Europe Established Market Economies 0 0 1 2 4 3 Clarke PM et al. PLoS Med. 7:e1000236. doi:10.1371/journal.pmed.1000236.
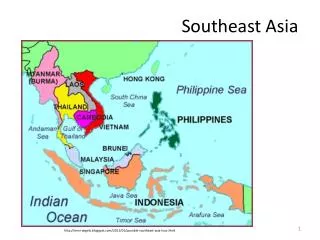
Increase in Age-Standardized Mean Total Cholesterol Levels in East and Southeast Asia and Pacific Region, 1980-2008 Men Women Southeast Asia: Cambodia, Indonesia, Lao People’s Democratic Republic, Malaysia, Maldives, Myanmar, Philippines, Sri Lanka, Thailand, Timor-Leste, Vietnam East Asia: China, Hong Kong (China), Macau (China), Democratic People’s Republic of Korea, Taiwan, Brunei, Darussalam, Japan, Republic of Korea, Singapore, islands of Oceania Farzadfar et al. Lancet. 2011;377:578-586.
Relationship of CHD Mortality With Usual Total Cholesterol by Age: Prospective Studies Collaboration Age at risk 1 mmol/L total cholesterol 900,000 participants from 61 prospective cohort studies (10% from Japan or China) 80-89 15% risk 256 128 18% risk 70-79 64 28% risk 60-69 32 42% risk 50-59 16 56% risk Hazard ratio (floating absolute risks & 95% CI) 40-49 8 Overall, 1 mmol/L lower total cholesterol risk by1/3 4 2 1 0·5 4·0 5·0 6·0 7·0 8·0 Usual total cholesterol (mmol/L) Prospective Studies Collaboration. Lancet . 2007;370:1829-1839.
Association of Stroke Mortality With Usual Total Cholesterol by Age: ProspectiveStudies Collaboration HR (95% CI) per 1 mmol/L Age at risk: 64 80-89 1.06 (1.00-1.13) 32 16 70-79 1.04 (0.99-1.09) 8 Hazard Ratio (floating absolute risks & 95% CI) 4 60-69 1.02 (0.97-1.08) 2 40-59 0.90 (0.84-0.97) 1 4·0 5·0 6·0 7·0 8·0 Usual Total Cholesterol, mmol/L Prospective Studies Collaboration. Lancet . 2007;370:1829-1839.
Relationship of Cholesterol Level to CV Mortality in Asians: Asia PacificCohort Studies Collaboration • 29 cohorts • 352,033 individuals • 283,544 Asians • 68,489 Australians/New Zealanders • 2 million person-years of follow-up • 4841 cardiovascular deaths Zhang X et al. Int J Epidemiol. 2003;32:563-572.
3.0 3.0 2.0 2.0 1.4 1.4 1.0 1.0 0.7 0.7 4.5 4.5 5.0 5.0 5.5 5.5 6.0 6.0 6.5 6.5 Association Between Usual CholesterolLevel and CHD Death or Nonfatal MI:Asia Pacific Cohort Studies Collaboration CHD death in theentire study population CHD death or nonfatal MI in the entire study population Hazard ratio 1 mmol/L lower total cholesterol associated with 35% (26%-44%) lower coronary death Mean usual total cholesterol (mmol/L) MI = myocardial infarction. Zhang X et al. Int J Epidemiol. 2003;32:563-572.
1.5 1.5 1.2 1.2 1.0 1.0 0.8 0.8 4.5 4.5 5.0 5.0 5.5 5.5 6.0 6.0 6.5 6.5 Association Between Usual CholesterolLevel and Stroke: Asia Pacific CohortStudies Collaboration Fatal stroke in the entire study population Fatal or nonfatal stroke in the entire study population Hazard ratio Mean usual total cholesterol (mmol/L) Zhang X et al. Int J Epidemiol. 2003;32:563-572.
2.0 2.0 1.5 1.5 1.2 1.2 1.0 1.0 0.8 0.8 0.6 0.6 4.5 4.5 5.0 5.0 5.5 5.5 6.0 6.0 6.5 6.5 Association Between Usual CholesterolLevel and Ischemic Stroke: Asia PacificCohort Studies Collaboration Fatal ischemic stroke Fatal or nonfatal ischemic stroke Hazard ratio 1 mmol/L lower total cholesterol associated with 25% (13%-40%) lower ischemic stroke (fatal or nonfatal) Mean usual total cholesterol (mmol/L) Analyses are stratified by study and sex and adjusted for age at risk, systolic blood pressure (BP), and smoking. Zhang X et al. Int J Epidemiol. 2003;32:563-572.
2.0 2.0 1.5 1.5 1.2 1.2 1.0 1.0 0.8 0.8 0.6 0.6 4.5 4.5 5.0 5.0 5.5 5.5 6.0 6.0 6.5 6.5 Association Between Usual CholesterolLevel and Hemorrhagic Stroke: AsiaPacific Cohort Studies Collaboration Fatal or nonfatal hemorrhagic stroke Fatal hemorrhagic stroke 1 mmol/L lower total cholesterol associated with 20% (8%-30%) higher hemorrhagic stroke (fatal) Hazard ratio Mean usual total cholesterol (mmol/L) Analyses are stratified by study and sex, and adjusted for age at risk, systolic BP, and smoking. Zhang X et al. Int J Epidemiol. 2003;32:563-572.
Summary Stroke is the leading cause of death in the East Asia and Western Pacific region CV risk factors and CV mortality are projected to increase Increased cholesterol levels are a major cause of the high risk for ischemic stroke in Asian Pacific countries