Download
1 / 38
380 likes | 517 Views
Methane Vent Mitigation Proposal for Demonstration Projects PTAC TIS November, 2001 New Paradigm Engineering Ltd., Edmonton, Clearstone Engineering Ltd., Calgary. Areas to Cover. Introductions Why focus on Methane Vent Mitigation? What might be Achieved Economically? What is Happening Now?

E N D
Methane Vent Mitigation Proposal for Demonstration ProjectsPTAC TIS November, 2001New Paradigm Engineering Ltd., Edmonton,Clearstone Engineering Ltd., Calgary
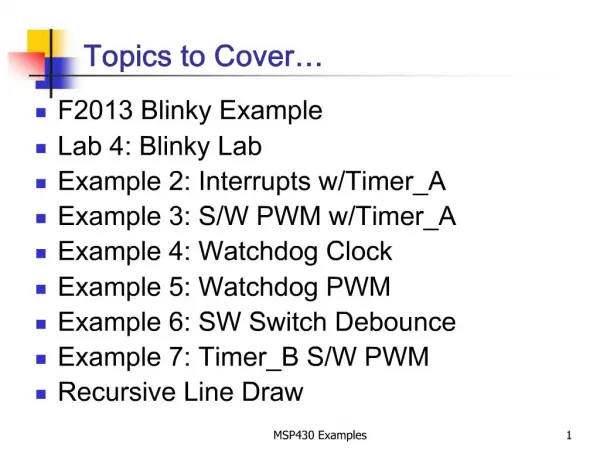
Areas to Cover • Introductions • Why focus on Methane Vent Mitigation? • What might be Achieved Economically? • What is Happening Now? • Why isn’t more Happening? • How Are Demonstration Projects Going to Help? • Proposal Details and Process • Next Steps?
About New Paradigm Engineering Ltd. • Independent consulting company, Inc. 1991 • Engineer “new paradigms” for industry • Small but supplement manpower with other specialists and consultants as needed for the work. • Last three years spent on assessing existing and new options for reducing methane emissions, through a series of Vent Options Studies and other activities. • Vent Option Studies Total - $190k (2000-01) • CHO Audits and Equipment Trials - $75k (1999-2001) • New Technology Development - $80k (1998-2001)
About Clearstone Engineering Ltd • In business since 1989 • Process and Environmental Engineering Specialists • Methane Related Experience: - Quantification of CH4 losses, and evaluation of control opportunities at gas production, processing, transmission and distribution facilities in Canada, US, Europe and Asia. - Preparation of CAPP’s control options document and emissions inventory for CH4 and VOCs - Work for IPCC & UNFCCC on fugitive emissions
Methane from the Upstream Industry • Over $400-$800M/yr of methane vented or emitted from upstream sites (@$3-$6/GJ) • Equivalent to over 20% of Upstream O&G Industry energy use • At the same time methane is also being flared. • Methane emissions from Upstream Sources • Almost 50% of oil & gas GHG emissions • Over 8% of Canada’s GHG emissions • Over 30% of Alberta’s emissions • GHG, Flaring and Odour Issues affecting O&G Development • Methane emissions have almost doubled since 1990
Methane - An Economic GHG Target • It has an economic value ($3-$6/GJ) • It can provide the energy to support it’s own use • It has a greater impact; 1 t CH4 = 18-21 tCO2e • Lower cost to convert than to sequester CO2 • Sequestration of CO2 usually in the US$20/tonne range • Many methane mitigation options are economic • <$US1.50/tCO2e to convert methane into CO2 • Many opportunities to use existing technology to reduce emissions. • Many designs based on gas at C$0.30/GJ and no concerns about methane.
What Comes with the Methane Vents? • Lost Opportunities to Increase Sales Revenues or to Reduce Energy Costs • Heavier Hydrocarbons that Could be Recovered • Volatile Organic Compounds (VOC’s), H2S and BTEX emissions • Source of Odours, Health Concerns and Public Resistance to Further Development and Lead to Flaring • Regulatory Pressure to Change
What Can Be Economically Achieved? • Work by New Paradigm, Clearstone & Others shows: • Fuel Displacement • Vent or flared gas can be used to fuel equipment. • Small investments and rapid payouts (months) • No point reducing vent/flare if you can use it as fuel • Vent Volume Reductions • Economic at many sites – payouts months to years • Manage Large Surpluses • Sell Gas, Power, or Liquids – Payouts 2-4 years • Methane Conversion to CO2 for Credits
Upstream Oil & Gas Methane Emission Sources Ref: CAPP Pub #1999-0009
Conventional Heavy Oil Potential • Methane Sources – Production Casing (95%), Tanks (5%) • An estimated 25-50% Displace fuel on leases • Payouts can be as short as 1-4 months • Likely 25-35% Used for Managed Options • Compression and Sales • Power Generation • Small Scale EOR • Fuel is essentially FREE! • Remainder Convert to CO2 for Credits
Methane Sources – Mainly Gas Operations Example Source – Data from One Producer
Conventional Gas Production Potential • Methane Sources – Dehydrators (25%), Instruments (50%), Pumps (20%), Incomplete Combustion (5%) • Almost all Displace fuel on leases with fired heaters • In example case – Methane vents could displace up to 30% of the fuel used by direct fired heaters. • Sites without fired equipment Reduce Volume • Change chemical pumps to drip pots • Replace instruments to low vent types • Where it is uneconomic to reduce vents Convert
Compression and Processing Potential • Methane Sources – Fugitives (70%), Incomplete Combustion (18%), Compressor Ops (12%) • About 16% of methane Gas Transmission • Fugitives Detection, Isolation and Repair of Leaks • Most of the emissions are from <0.5% of the fittings • To be economic – minimize cost of finding the leakers as the cost to fix usually minimal. • Compression a Large Fuel Demand • Improve combustion efficiency • Conserve starting gas, blowdowns, and seals – use as fuel
Oil Production Potential • Methane Sources – Mainly Tank Vents, Instruments and Pumps • Need better data to breakdown relative shares. • Oil Production only 8% of methane but 32% THC due to product losses from tank vents. • Liquids Recovery • Use methane in vents to fuel vent condensors to recover liquids • Displace Fuel • Use gas from instruments and chemical pumps for building heat and burners.
Thermal Heavy Oil Potential • Main problem is energy efficiency more than methane venting • Highest per bbl oil energy cost low value bbls • Initial focus of options studies on small thermal operations in Lloydminster area • Greatest challenge as no economies of scale • Improve Efficiency of Surface Facilities • Increase Percentage of Energy Going into the Reservoir • Investigate low cost fuel switching
Methane Sources: Small isolated vents; Fugitives too small to stop; Incomplete Combustion (engines, burners) Pressurized Streams Relatively Easy Conversion cost is lower than any CO2 reduction options Flares, combustion units and catalytic converters Dilute Sources Require More Research: Collection and Concentration of Methane Conversion Energy Recovery Methane Conversion Any Sector
Methane Conversion Calculations • The “math and science” of converting methane to CO2 • Stoichiometric formula is: • CH4 + 2O2 CO2 + 2H2O + Energy • Molar basis – 1 mole methane 1 mole of CO2. • Mass Basis – 1t CH4 + 4t O2 2.75t CO2 + 2.25t H2O • GHG emissions based on mass; 1 t CH4 = 21 t CO2(eq) • 1 t CH4 converted to CO2 forms 2.75 tonnes of CO2. Emission reduction = 21 – 2.75 = 18.25 tCO2(eq). • If vent gas displaces fuel gas then 21 tCO2(eq) is saved.
Methane Conversion Economics • GHG credits normally considered as a change from 1990 levels so may have to determine base line emissions level • Need someone to test the system. • Value of GHG credits • Recent trades US$0.50-$2/tCO2(eq) to C$4.50-$17.00 • Some on-line trading going on: GERT, KEFI & Others • For positive economics conversion of 50 m3/d of methane cost of system must be about C$5k • Payout in 10 years @ C$1.50/tCO2e • Payout in 1 year @ C$15/tCO2e
What is Happening Now? • Reporting through Voluntary Change Registry (VCR) • Not all companies are participating • Focus is on high-level volumes and not economics • Often results achieved or hidden by takeovers and mergers • Too high a level to help others • Options good for one situation may not be good for all • Leading Producers are Making Gains in Some Sectors • Other companies or even departments don’t hear about it. • Management often assumes that cost is high and gains are for public image, not economic indicators.
Real Life Examples CHO Fuel displacement • Husky using vent gas at many leases year round using engine waste heat for tracing lines to stop freezing. • Devon (Anderson) used basic separators and methanol on 82 wells and saved $1.6 million/yr and over 145,000 t CO2(eq)/yr in GHG emissions. $3000/well & $230/mo. • Others have used small compressors, CaCl dryers, electric tracing off drive engine to utilize vent gas. • Demonstration Projects would provide resources to document these successes more fully.
Why isn’t More Happening? • High Demands on Resources • Exploration, acquisition and asset growth require money and people. Few people have time to work on vent issues. • Focus on own Business Units, rather than Corporate or Industry Targets • Economic Value of Vent Gas Not Recognized • Responsibility Passed to Field Staff w/o Resources • It is a change from “Common Practice” • Lower Cost to Change New Sites than Fix up Old Ones
How Are Demonstration Projects Going to Help? • Provide knowledgeable resources to help sort out what to do and provide assistance. • Method to pass results on to others at no cost to Producer and no staff time away from everyday work. • Results and Analysis Reported in a consistent fashion • Transfer what is learned in one area or sector to others with similar issues. • Help Leaders improve and get better. • Motivate Followers to learn and get started.
Demonstration Project Goals • Encourage and support producers (Producer Benefits). • Audits to highlight and quantify the main sources • Recommendations to achieve cost effective solutions • Enable proactive decisions rather than reactive band-aids • Focus on the largest emission areas first • Promote communication (Industry & Society Benefits) • Develop both technical and economic results • Consistent reporting by a third party • Provide manpower and funds to communicate widely • Papers, presentations, web-sites and courses.
Work Scope – Prioritized Target Sectors • Conventional Heavy Oil • Gas Production Facilities • Oil Production Facilities • Thermal Heavy Oil Operations • Gas Processing/Compression Facilities • Methane Conversion – Credit/Offset Trading • Effort varies with the sector, what has already been done by the Producers and size of the operation
Proposed Process #1 - Producer Decisions • Initial audit by team • Type and volumes of sources • Identify Local Opportunities • Highlight best options for the area • Recommend Implementation Method and estimate Budget • Producer reviews audit with team support • Decides which opportunities to pursue • Plans project • Sets budget • Decides if they want to make results public • Decides if they want to be named or be anonymous
Proposed Process #2 – Demo Approval • Team Prepares summary of demonstration details • Key emissions targeted, budget and plan • Assessment of value as a model for the sector • Prepare plan and budget for detailed case study and communications. • Participant’s Panel (funders plus demo hosts) • Reviews opportunity summary and plan. • Allocates a percentage of the pre-committed funds to the demo project. • Locates additional funding if appropriate ($100k min assumes $15k/demo and only 6 demos.)
Proposed Process #3 – Demo Execution • Producer Proceeds with Project Implementation • May or may not wait for Demo Approval • Controls project schedule, cost and scope • Adjusts as appropriate • Team provides support as requested and reports on progress as appropriate. • Team Prepares Follow-up Report • Compare Plan to Actual • Demonstrated reductions and economics, etc. • Takes information “on the road” to communicate to others
Proposed Deliverables per Sector • Audit Report on Volumes and Proposed Actions • Analysis & Recommendations to Producer • Action Plan Preparation • Producer decides on what emissions to tackle and assigns resources. Summary taken to Participant Panel • Follow-up Report • Full Document with results, technical and economic, lessons learned, recommendations for others • Powerpoint format (paper and electronic) • Presentations (CIM and others), Courses
Demonstration Summaries • Standard format and contents: • Site Layout, • Emission Sources and Volumes • Potential Options Identified • Options Selected and Why • Implementation Plan and Budget • Project Execution • Technical and Economic Results, • Operator Issues, • Post Project Emissions Audit, • Implementation/Regulatory Issues
Funding • Producers fund initial audits and implementation • Retains control at all times, not committed to do anything that is uneconomic, unsafe, experimental, etc. • Site audits $2k-$25k/each (depends on scope) • Potential for 50% of audit (up to $5k) paid for NRCan • Implementation $50k?? (depends on opportunities) • Participating Organizations fund non-economic activity • Prescreening of proposed demo sites • Preparation of a comprehensive report for each demo • Communication of results by Team • Min $100k from CAPP, Alta Gov’t, Federal Gov’t, others
Agreement Terms • For Initial Audit and Planning (Producer/Team) • Standard P.O. or Invoice to either New Paradigm or Clearstone, based on standard rates & scope set by Producer • Agreement to Participate (Producer/Participants) • Producer agrees to make information available to the Team that is necessary to complete an analysis. • May include information exclusions if defined up front. • Participants - no responsibility for execution, or liability for releasing information provided by the Producer. • Funding Agreements (Participants/Team) • Similar in scope but vary with funding agency.
Summary of Proposal • Want to develop the project as a Win-Win • Producers get needed support to achieve economic results, emissions reductions while retaining control • Funding Participants get results communicated widely to stimulate new activity and understanding of issues; leading to more and accelerated emission reductions • Proponents get to apply their knowledge and receive compensation for analyzing and promoting the results • Demonstrate potential benefits for all Conventional Upstream Oil and Gas Sectors
Next Steps? • Applications are being submitted to a number of potential funding sources (Industry and Gov’t) • Seeking upfront commitment to an initial $100k • Funds only spent if Producer’s come forward • PTAC considering administering NRCan funds for audits • Producers Approached by Team to Discuss: • Potential target projects that might serve as demos • Potential concerns with information releases • Potential agreement terms • Initiate the first demonstration to serve as a model
Questions and Discussion? • Producers: • Do you believe there are economic solutions? • Do you want support to assess, implement and report on your successes? • What are your initial concerns? • Potential Funders • Can you allocate funds up front, before Producers sign on • What are your initial concerns? • Other Stakeholders (Vendors, Researchers, NGO’s) • What are your thoughts and concerns?
Acknowledgements • Support of Husky (Ron Schmitz) and Alberta Environment (Bob Mitchell) for this information session. • Current Participants for Conventional Heavy Oil – AEC, Devon, Husky, CNRL, Nexen, Exxon-Mobil, EnerPlus Group, CAPP, AERI • Current Participants for Thermal Heavy Oil – Nexen, Husky, CAPP • Current Participants for Conventional Oil and Gas – BP Energy, Husky, CAPP • Support from the Petroleum Technology Alliance Canada (www.ptac.org)
Contact Information New Paradigm Engineering Ltd. C/o Advanced Technology Centre 9650-20 Avenue Edmonton, Alberta Canada T6N 1G1 tel: 780.448.9195 fax: 780.462.7297 email: bruce@newparadigm.ab.ca web: www.newparadigm.ab.ca