Download
1 / 17
170 likes | 266 Views
New evidence that shows the WDC publication draft Local Plan needs revision. ONS mid 2012 population projections APPENDIX 1. The Publication draft Local Plan relies on the JointSHMA as its evidence. Joint SHMA recommends Proj1A for a population growth of 23,858 over 20 years.

E N D
New evidence that shows the WDC publication draft Local Plan needs revision. ONS mid 2012 population projections APPENDIX 1
The Publication draft Local Plan relies on the JointSHMA as its evidence. • Joint SHMA recommends Proj1A for a population growth of 23,858 over 20 years. • Local Plan is for 18 years, so commensurate population growth is 21,472. • Joint SHMA says that 14,363 dwellings are needed for 20 years. • At 718 dwellings per year for 18 years this needs 12,924 dwellings. • The resultant overall household density in 2029 becomes 2.181 which is a low figure compared with the 2011 census result. This number means that the average household density of new homes would be 1.661 • The 2011 census found that, excluding communal establishments, WDC household population was 134,590 and 58,679 dwellings had at least 1 usual resident. The density was 2.294 persons per dwelling. • 2011 census took place in March 2011. the total WDC population was 137,648. By mid 2011, ONS estimate the population had grown by 88 persons and was then 137,736. The household population became 134,678.
On 29th May 2014, the ONS mid 2012 population projections were published. • The ONS mid 2012 population projections for an18 year plan give the following • So the population growth is less than previously thought, being 15,313 rather than 21,472, a fall of 6,159 persons or 28.7% reduction. • This is very significant since it changes the number of dwellings that will be necessary, the amount of infrastructure needed to support the increase in population, reduces the greenfield needed to be taken for housing and improves the 5 year housing land supply position.
Why has this change in projection occurred? • Population changes occur for 3 reasons - • Natural – births & deaths • Movements between local authority areas • International Migration into the area Comparing births & deaths in the last 5 years when the average increase was about 375 per year, there is an increase in the projections to 2029 to an average of 464 giving a population increase for these reasons of 8,343 over the plan period.
Movements between local authorities and cross border. • Net movements between local authorities peaked in 2003 at an inflow of 1,859. Since then net inflow has fallen until in 2008 there was a net outflow of 67. • 2009 saw a net inflow of 388 but then returned to an outflow of 322 & 742 in 2010 and 2011. 2012 saw a net inflow of 302 whilst 2013 had a net outflow of 244. • From 2013 cross border movement between England & Wales and Scotland and Northern Ireland was collected.255 people came in whilst 355 went giving a net outflow of 80. Since there is only 1 year of data available, this is used in the projection until 2029. • From 2014 a return to new inflow is predicted, rising to 385 by 2017 but then staying in the 350+ until 2022. After then it rises gradually to 463 in 2027 & 2028 falling to 433 in 2029 • The population increase for these reasons is 5,971 over the plan period.
International migration in & out of Warwick District • Although net movements between local authorities and International migration looks similar, there are about 8 times the number of people involved. Example – in 2006 Local Authority in was 8461 & Local Authority out was 8091 giving a net of 370 inflow. International was 1369 in and 941 out giving a net of 428. • Between 2002 & 2008 net international inflow was between 610 and 130 in an erratic fashion. • By 2009 it became a net outflow of 18. In 2010 the outflow was 216 and in 2011, 139. • In 2012 there was a small net inflow of 68. This is projected to remain a small inflow from 2013 of 53, rising slowly to 91 in 2016, but then falling to 50 by 2019, where it remains until the end of the plan period. • The population increase for these reasons is 999 over the plan period. Is this pattern in line with national trends?
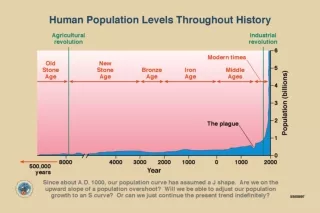
The data on which the JSHMA is based came from a period of unusually high migration.Migration to UK between 1964 & 1988 was a net outflow, but it was a fairly steady state. Between 1988 & 1998 there was a small inflow and from then, a large net inflow occurred, peaking in 2007. By 2012 the net immigration was 177,000 to the UK but both Immigration and Emigration were falling towards the previous steady state .
Converting population growth to housing numbers • The JointSHMA does not give reasons for the household density selected, which varies widely depending on both projection & authority area. From the 1st slide, the effect of the JSHMA is to reduce the dwelling density by 2029 to 2.181 from the 2011 census density of 2.294. • Between 2001 and 2011 censuses, the density rose from 2.245 to 2.294 persons/household. ie.,plus 0.049 in 10 years. This suggests that household sizes are not falling. • A fall from 2.294 to 2.180 would be 0.114 in 18 years which seems to be high and no evidence has been given that this will happen. • Dwelling density is constantly changing and all wards in the district have a different density, from Clarendon ward at 1.996 to Brunswick at 2.569. • Dwelling density is more dependent on the number of rooms and bedrooms in properties in the area being considered. • Very small changes in household density can make a big difference to the housing numbers needed. • The 2011 census provides data on the number of homes of each dwelling type and number of people that live in each type. This gives a household density for the existing households in a 'mature' urban district and shows the way that housing type and size affects the density, with the proportion of each house type being a key factor in the overall household density.
The housing densities considered so far are set out in this table, together with comments on their relevance. The calculation is based on a 2029 population of 149,991 excluding communal establishments. So what housing density should be used to convert population to homes?
Comparison of the Joint SHMA with the ONS mid-2012 projection gives the following additional population for the whole HMA. The Joint SHMA identified a need for 67,536 homes. The revised projections now identify 68,152homes based on the same JSHMA household densities. What is the situation in the rest of the Housing Market Area?
Coventry's mid-2011 ONS estimated population was 316,915. By mid-2029 the population is projected to be 391,711. This is an increase of 74,796. Over the 18 year plan period, births are predicted to rise gradually by about 50 a year on average from 4,700 to 5,600. Deaths are expected to fall from 2650 in 2012 to about 2475 in 2021 and slowly rise again to 2575 a year by 2029. Overall, the net effect of natural change will lead to a population increase of 50,734 by 2029. People moving in and out Coventry from other parts of the UK currently give a net outflow. In 2012 for example 16,392 people came in whilst 17,384 went elsewhere. Over the 18 years the projections show a net outflow of 50,592 people. The graph shows the net inflow of 17 to 20 year olds is countered by the net outflow of 21 to 29 year olds indicating students to the universities. The Warwickshire districts now expect between 25% and 30% less population, but Coventry is projected to expect a 70% increase.Why is this?
4. However, International migration into Coventry has 2 problems. Between the 2 universities there are currently about 13,500 international students, 5000 of whom are at Coventry University. On the graph, the top 3 lines show the age groups 21 to 24, 17 to 20 and 25 to 29. Students would normally be on 3 or more years study. It would be expected that when the international student level had been running for some time the numbers arriving should roughly equal the numbers leaving. But the ONS projections show thata) in 2002, the net inflow was low. From 2003, the intake of international students began to grow so that by 2011 there was a net inflow of over 2,500. But the numbers departing don't come in until the end of courses and perhaps related experience jobs or research. So the ONS projections use the intake over the last 6 years, but the outflow only started to get up to the same level in 2011. The ONS statistically take their projections from the previous 6 years so as yet do not fully show the numbers that can be expected to depart. Hence the numbers of international migrants is showing as artificially high. b) because of the way the numbers are calculated, the artificially high intake figure is projected over the whole of the remaining period of the plan. This results in a cumulative international inflow of 74,654. When the inflow and outflow balance, the continual addition to international migration will not occur and all the students will have accommodation already provided as turnover occurs.
5. A more realistic way to consider international migration is to take out this temporary student bulge. This is difficult to do from the ONS data alone. To give a range of the potential and in/out slippage, 2 ways have been assessed to adjust the student age groups (17 to 34) in and outflows to establish non-student numbers.a) take the averages of the younger and proximal older age groups and add 25% to allow for the normal additional migration patterns occurring in the student age groups by non-students. This suggests a population growth of about 25,000 over the 18 years based on all non-students ( the graph illustrates this method) ; orb) take the average of the years 2002 to 2005 for the relevant age groups projecting forward on a 3 year average which will include the 2002 to 5 level of student intake. This suggests a population growth of about 40,000 over the 18 years.For the purposes of this HMA population change assessment , the higher number is used, although the probable level is somewhere between the two.
Therefore, after allowing for these factors, Coventry also will see a reduced additional population of between 25,000 and 40,000 rather than 74,796. Over the whole HMA, the population increase is expected to be 94, 954 rather than 123,882, with at least a commensurate housing reduction. This should not require any of the other HMA areas to provide for Coventry as it's housing requirement is reduced by some 2,000 homes. This is a significant change and should be taken into account when preparing the District Council's Local Plan for the plan to be sound as otherwise there will be ramifications on other aspects of the plan including the use of greenfield sites when it is unnecessary to do so .
Warwick's population projection is now 28.7% less than the consultation draft local plan so is no longer up to date. All the other authorities in the Housing Market area are also showing similar reductions in their population projections, including Coventry after allowing for the temporary student bulge. Overall it is, depending on the Coventry student bulge,between 23.35% & 36.3% lower than the JSHMA. The method by which population is converted into the number of dwellings required needs better determination by calculation, using the known housing type and size to be included in the plan. The lower housing target will require the list of sites to be included in the plan to be reduced, brownfield sites being put first and only including greenfield where essential, as well as an immediate revision to the 5 year housing land supply calculation. Dependent matters such as infrastructure needs and costs will then need to be matched to the new lower target. Conclusion