Download
1 / 13
130 likes | 274 Views
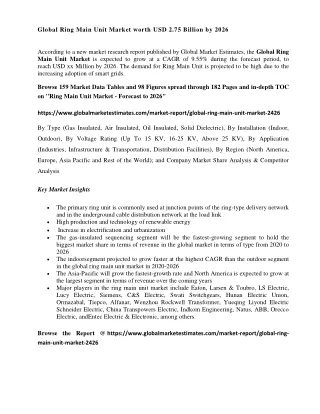
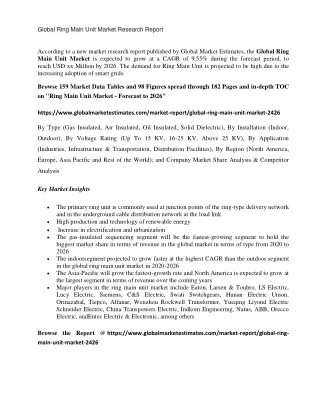
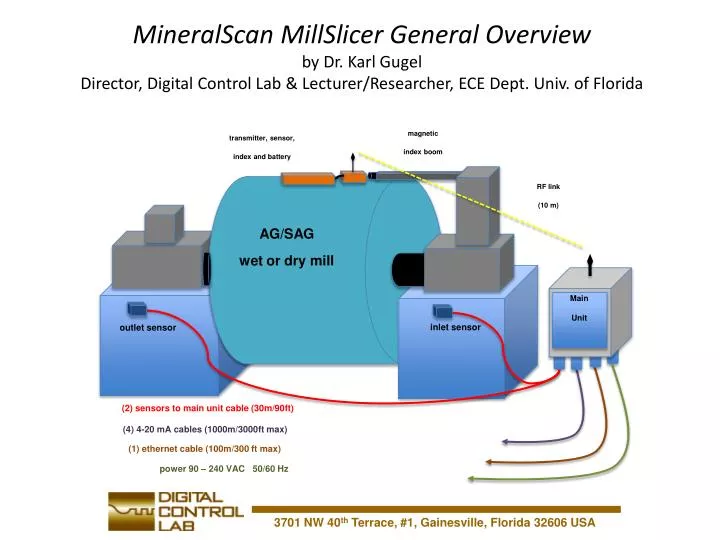
magnetic index boom. transmitter, sensor, index and battery. RF link (10 m). AG/SAG wet or dry mill. Main Unit. inlet sensor. outlet sensor. (2) sensors to main unit cable (30m/90ft). (4) 4-20 mA cables (1000m/3000ft max). (1) ethernet cable (100m/300 ft max) .

E N D
magnetic index boom transmitter, sensor, index and battery RF link (10 m) AG/SAG wet or dry mill Main Unit inlet sensor outlet sensor (2) sensors to main unit cable (30m/90ft) (4) 4-20 mA cables (1000m/3000ft max) (1) ethernet cable (100m/300 ft max) MineralScan MillSlicer General Overviewby Dr. Karl Gugel Director, Digital Control Lab& Lecturer/Researcher, ECE Dept. Univ. of Florida power 90 – 240 VAC 50/60 Hz
MineralScanMillSlicer - System Components Shell Mounted Transmitter & Battery Pack Fixed Position Vibration Sensor Shell Mounted Battery Pack, Transmitter & T Sensor
MineralScan MillSlicer - System Components Magnetic Boom & T Sensor w/Transmitter
MineralScan MillSlicer - System Components Main PC Unit Mounted Near Mill Main PC Unit (inside view) Pole Mount RF Antenna
MineralScanMillSlicer – Installation Steps Mill is cleaned for TSensor, Transmitter and Battery Pack T Sensor, Transmitterand Battery Pack are placed on the mill Magnetic Index Boom Placement at a fixed position at the end of the mill - Verify 4 cm or less clearance/alignment between boom & T Sensor Metal templates are placed around the T Sensor, Transmitter and Battery Pack - high temperature epoxy is applied to fix the templates 5. Main Unit placement, such that it is within 30 meter from each end of the mill - fixed position sensor cable lengths are typically 30 meters 6. Attach the receive antenna to the Main Unit - verify transmitter/Main Unit communication (50 meters max, line of sight) - relocation of the Main Unit may be required so it is important to verify communication before connecting the ethernet & 4-20mA signals Fixed position vibration sensors placement (Inlet & Outlet) Attach (4) twisted pair 4-20mA cables from Main Unit to a PLC in MCC room - verify 24VDC is being supplied by the PLC via LEDs on 4-20mA boards 9. Attach standard Ethernet cable between Main Unit - PC can be electrical or control room and should be tied to plant’s WLAN
MineralScan MillSlicer – Calibration & 4-20 mA Outputs Quick Calibrations are made on all three vibration sensors - estimate current fill level and set the sensitivity (signal dynamic range) - this takes ~1 minute per sensor and is very easy to learn Set ranges (sensitivity) for the Toe Entropy signal - ~1 minute to set and again is very easy to learn and adjust Observe trends and adjust the sensitivity for 3 vibration inputs and Toe Entropy if needed. Note: It is important to run the mill between normal operation and 30% of normal operation (~30% full) to observe new signal trends. (4) 4-20 mA Output Definitions: i. Inlet fill level (0% => 4 mA, 100% full => 20 mA) ii. Outlet fill level (0% => 4 mA, 100% full => 20 mA) iii. Shell sensor fill level (0% => 4 mA, 100% full => 20 mA) iv. Toe Entropy (4 mA => min. liner damage, 20 mA => major liner damage)
KGHM/RMNC MillSlicer – Polar Results - Ore Type Detection Hard Ore (88% Full) Hard Ore (12% Full) Soft Slurry (Mud) 1. Hard/Normal Ore has a well defined toe area vs. none for the muddy type 2. Toe Entropy is a measure of the sharpness of the polar plot in an predefined arc in the toe region. 3. As the mill empties, the toe signal begins to sharpen and is a good indicator of when balls are striking the mill shell. i.e. “Metal on Metal” condition.
Barrick Gold MillSlicer – Polar Results - Operators Guide mill rotation mill rotation mill rotation Better Best! Bad Ball trajectory 135O 135O 135O liner strike energy liner strike energy Case 1. Empty Mill w/Excessive RPMs Case 2. Empty Mill w/Good RPMs Case 3. Full Mill & Cascade Grinding • Mill is rotating in a clockwise direction • Sensor on shell measures vibration energy in the full rotation and energy is plotted increasing toward the center of the plot • RPMs are too high so balls strike high on the opposite side of the liner causing sharp energy peaks from 90 – 135 degrees. • Extreme excessive wear/damage to the liners • Snap shot taken on a mill being ground out at low speed (85% speed) • No sharp peaks from 90 – 135 degrees which is good • Liner strike energy from 135 – 270 degrees is high but there is nothing we can do about this, it is a result of the mill being empty • Grind-outs should be always done at low speeds (80-85%) by cutting the feed • When the mill begins to fill to levels above 50% on the shell sensor fill level trend, we see a focusing of the grinding energy in the region from 135 – 180 degrees • Optimal cascade grinding is occurring and we are operating the SAG mill per it’s intended design • Ball to liner strike energy significantly reduces to very low levels. i.e. compare the liner strike energy between Cases 2 and 3 from 180 – 270 degrees • Optimal grinding & minimal liner damage!
Typical Expert System Control (RNMC) – Bearing Pressure Feed Speed Toe Entr Pressure Out Vib Shell Vib In Vib Hard/Coarse Ore Signal Definitions: Green- Inlet Sensor, Blue - Outlet Sensor, Yellow - Shell Sensor Light Purple - Toe Entropy, Red- Toe (unused), White - Shoulder (unused) Olive- Mill RPM, Purple - Mill Pressure, Teal Blue - Mill Feed Note: Toe Entropy Signal 4-20mA signal was inverted during this test to visually correlate with the fill level signals.
MillSlicer RNMC Fill Level Control – Outlet & Shell Sensor Toe Entr Feed Out Vib Shell Vib In Vib Pressure Speed Hard/Coarse Ore Signal Definitions: Green- Inlet Sensor, Blue - Outlet Sensor, Yellow - Shell Sensor Light Purple - Toe Entropy, Red - Toe (unused), White - Shoulder (unused) Olive - Mill RPM, Purple - Mill Pressure, Teal Blue - Mill Feed Note: Toe Entropy Signal 4-20mA signal was inverted during this test to visually correlate with the fill level signals.
RNMC Expert System vs. MillSlicer Fill Level Control Shell Vib Out Vib Speed Feed In Vib Pressure Shell Vib Feed In Vib Out Vib Speed Pressure Soft/Fine Ore Toe Entr Green - Inlet, Blue - Outlet, Yellow - Shell, Pink - Toe Entropy, Olive - RPMs, Purple - Pressure, Teal - Feed
RNMC Material Blockage & Mill Speed Change Effect Blockage End Mill speed is increased to reduce the blockage Overshoot the end of blockage and so mill empties out too low. Blockage Start Shell Vib Feed Out Vib In Vib Feed is held constant (some variation due to feeder). Mill Speed is significantly increased and then decreased. Speed Pressure Soft/Fine Ore Toe Entropy spike shows where liner damage is occurring. Toe Entropy Green - Inlet, Blue - Outlet, Yellow - Shell, Pink - Toe Entropy, Olive - RPMs, Purple - Pressure, Teal - Feed
MineralScan MillSlicer – Conclusions • Toe Entropy is an indicator of the “metal on metal” condition (balls striking liner) • Polar plots can be used to identify material type and grinding efficiency • Soft ore (smooth even plot) vs. Hard Ore (energy in ball strike region only) • For soft finer ore, the outlet vibration sensor should be used for auto-control • For hard coarse ore, the shell based sensor is best for auto-control • Shell signal is several minutes ahead of bearing pressure (primary control) • It is the most responsive vibration signal of the three available • When either shell or outlet signals are used for control, pressure should be used • to adjust/change the auto-control set point based on the vibration signal • i.e. if vibration current set point = 85%, pressure is too high, lower SP to 83% • Feed should be kept at a constant rate and mill speed should be used for control • Fixed speed mills – control feed automatically with fill level signal • Mill speed should only be changed in small increments infrequently • - ~ 1 RPM change in the Mill RPM control room variable every 5 minutes • Optimum performance occurs when all three vibration signals correlate in parallel • “what goes in = what goes out”