Download
1 / 15
150 likes | 408 Views
Heavy rain event in TX/OK on 8-10 October 2011. Show part of the event here (runs from 00z/10 October) Summary There is an explosion of reflectivity in the LAPS and STMAS forecasts right away Noticed this in other cases I have saved over the last month

E N D
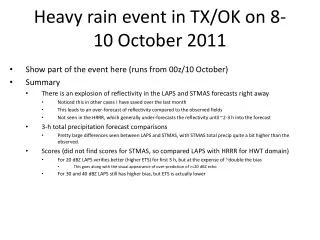
Heavy rain event in TX/OK on 8-10 October 2011 Show part of the event here (runs from 00z/10 October) Summary There is an explosion of reflectivity in the LAPS and STMAS forecasts right away Noticed this in other cases I have saved over the last month This leads to an over-forecast of reflectivity compared to the observed fields Not seen in the HRRR, which generally under-forecasts the reflectivity until ~2-3 h into the forecast 3-h total precipitation forecast comparisons Pretty large differences seen between LAPS and STMAS, with STMAS total precip quite a bit higher than the observed. Scores (did not find scores for STMAS, so compared LAPS with HRRR for HWT domain) For 20 dBZ LAPS verifies better (higher ETS) for first 3 h, but at the expense of ~double the bias This goes along with the visual appearance of over-prediction of >=20 dBZ echo For 30 and 40 dBZ LAPS still has higher bias, but ETS is actually lower
Runs from 00z/10 Oct 2011 - Analyses0-h Composite ReflectivityThe reflectivity scale is the same for the LAPS/STMAS runs, so there are some small differences in the initial composite reflectivity fields. LAPS analysis STMAS 0-h HRRR 0-h LAPS CONUS 0-h
Runs from 00z/10 Oct 2011-Analyses0-h Surface ReflectivityWe do see some differences in the initial surface reflectivity fields between STMAS and the LAPS CONUS run (and of course the HRRR, which at the initial time is more representative of the 13-km RUC scale). The NOWRAD reflectivity has a similar (but not identical) scale to LAPS/STMAS, so a conclusion from this would be that the 0-h model surface reflectivity is weaker than the observed reflectivity. STMAS analysis STMAS 0-h NOWRAD and observations HRRR 0-h LAPS CONUS 0-h
Runs from 00z/10 Oct 2011 15-min Composite Reflectivity valid 0015zThe most obvious thing we see in the STMAS and LAPS forecasts is the “explosion” of reflectivity by 15-min into the forecast. In the LAPS CONUS run it is more over KS, while in STMAS is more elongated across the entire domain. We do NOT see this change in the observed field (LAPS Analysis), nor in the HRRR (in the HRRR starting to see “scaling” to the 3 km model scale. LAPS analysis STMAS HRRR LAPS CONUS
Runs from 00z/10 Oct 201115-min Surface Reflectivity valid 0015zDifferences in the surface reflectivity fields between STMAS and the LAPS CONUS run are seen. No verification field is available for 15-min in, but do have a NOWRAD image for 0030z (next set of slides). STMAS NOWRAD and observations not available HRRR 15-min surface reflectivity not available LAPS CONUS
Runs from 00z/10 Oct 2011 30-min Composite Reflectivity valid 0030zThe composite reflectivity forecasts from STMAS and LAPS do not change too much between 15 min and this 30 min forecast, with somewhat more of a change for LAPS (increase in higher level reflectivity, especially the smaller-scale cells in OK into northern TX). Comparison to the LAPS analysis indicates both would be an over-forecast, which is seen in the bias verification (shown later). LAPS analysis STMAS HRRR LAPS CONUS
Runs from 00z/10 Oct 201130-min Surface Reflectivity valid 0030zDifferences are seen in the surface reflectivity forecasts with STMAS somewhat smoother overall. The color table in the NOWRAD is close to the model color table, and there is only a small amount of reflectivity over 50 dBZ in the observations compared to the forecasts. STMAS NOWRAD HRRR 30-min surface reflectivity not available LAPS CONUS
Runs from 00z/10 Oct 2011 1-h Composite Reflectivity valid 0100zThe composite reflectivity forecasts from STMAS and LAPS do not show as much increase as they did in the first 15 min of the forecast, but compared to verification both are still over-forecasts, while the HRRR is somewhat under-forecast (and also still rather smooth). LAPS analysis STMAS HRRR LAPS CONUS
Runs from 00z/10 Oct 20111-h Surface Reflectivity valid 0100z.It is pretty clear that at the surface there is far more reflectivity (both higher-level and 20 dBZ level) than in the observed field for both STMAS and (to a lesser extent) LAPS. The HRRR is at the other end of the spectrum with too little forecast reflectivity. STMAS analysis STMAS NOWRAD and observations HRRR LAPS CONUS
Runs from 00z/10 Oct 2011 2-h Composite Reflectivity valid 0200zSTMAS now has quite a bit more of the ~20-30 dBZ mid level echo compared to LAPS, which is settling down more. HRRR reflectivity area is growing and is now fairly close to the LAPS analysis. Interesting that for LAPS and STMAS the situation is reversed over eastern CO (LAPS more reflectivity, STMAS less). LAPS analysis STMAS HRRR LAPS CONUS
Runs from 00z/10 Oct 20112-h Surface Reflectivity valid 0200zSurface reflectivity comparisons are pretty similar to what we saw for the 1-h forecasts. LAPS analysis STMAS NOWRAD and observations HRRR LAPS CONUS
Runs from 00z/10 Oct 2011 3-h Composite Reflectivity valid 0300zSTMAS now has even more of the ~20-30 dBZ mid level echo compared to LAPS and to the observed (see arrows). LAPS still has too much 50+ dBZ echo compared to what is seen in the analysis. The HRRR reflectivity area now looks pretty close to the LAPS analysis. LAPS analysis STMAS HRRR LAPS CONUS
Runs from 00z/10 Oct 20113-h Surface Reflectivity valid 0300zSeems to be a gradual decrease in forecast reflectivity in LAPS (now maybe too little compared to the analysis?), while STMAS isn’t too far off in area of ~20 dBZ and greater echo. HRRR area of ~20 dBZ echo is still on the low side. LAPS analysis STMAS NOWRAD and observations HRRR LAPS CONUS
2-3” max (Several in line) 1.25” max 3.00” max Runs from 00z/10 Oct 2011-3-h Total precipitation forecasts ending 0300zSTMAS, which had the greatest coverage of higher level reflectivity, ends up producing the most rainfall (quite a bit more then the verification showed). LAPS and the HRRR forecasts are closer to what was observed. No forecast correctly predicted the location of the 3”+ observed maximum near the sw LA/TX border, but LAPS and the HRRR have a max nearby. QPE analysis STMAS 2-3” max (only one, rest are 1-1.5 and a couple of 1.5-2”) 1-2” maxima (several in line) HRRR LAPS CONUS
LAPS - green 20 dBZ Bias Bias and ETS scores: LAPS and HRRR compared (STMAS apparently not available for verification). LAPS verifies better but with higher bias (excessive coverage). 20 dBZETS HRRR - blue 30 dBZ Bias 30 dBZETS Note that for the higher reflectivities the ETS score is only better for < 15 min, but the bias is still quite a bit higher for LAPS. 40 dBZ Bias 40 dBZETS