Download
1 / 12
140 likes | 333 Views
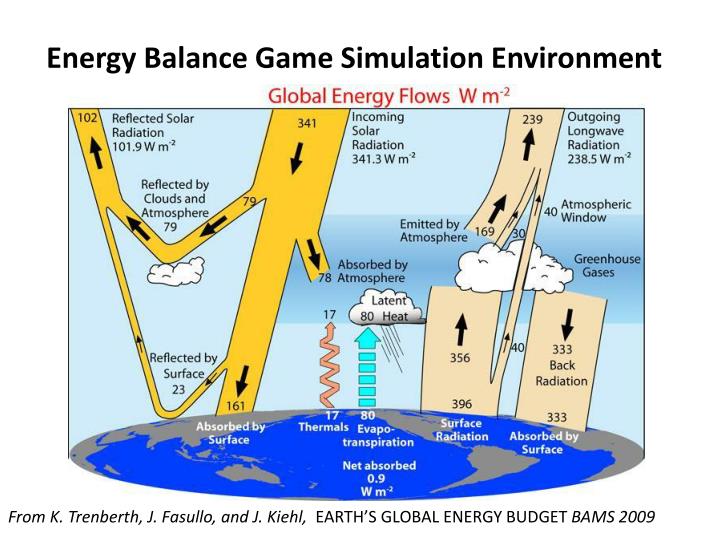
Energy Balance Game Simulation Environment. From K. Trenberth, J. Fasullo, and J. Kiehl, EARTH’S GLOBAL ENERGY BUDGET BAMS 2009. Energy Balance Game Simulation Environment.

E N D
Energy Balance Game Simulation Environment From K. Trenberth, J. Fasullo, and J. Kiehl, EARTH’S GLOBAL ENERGY BUDGET BAMS 2009
Energy Balance Game Simulation Environment The URL of the game program is www.atmosedu.com/meteor/ejs/ejs_EBMA.jar . This is a stand-alone Java Program, save it to your computer, and then open it. An overview of the model structure and physics is given at http://www.atmosedu.com/meteor/ejs/IntroductionToClimateModeling.pdf Most computers have the Java run-time environment installed, if you don’t, you can get it from http://www.java.com/en/download/index.jsp .
Full Simulation Window Graphical Output Input Controls Run Simulation and reset buttons
Graphical output The simulation uses energy flows at the surface and top of atmosphere to predict the evolution of the model Earth’s global mean surface temperature. Two simulations are shown. The first is the control simulation which has no changes in input values so shows that the model starts in equilibrium (about 288 K). The second simulation shows an increase in temperature to a new equilibrium after an increase in carbon dioxide.
Graphical output The Global Mean surface temperature SrfTemp(K), surface temperature Change from beginning to end of the 50 year simulation DTs(K), and initial radiative forcing are also provided as numerical output. These values will not be needed for the Games assignment
The input control Atmospheric CO2 in PPM and the growth of CO2 in percent per year may be changed with the slider control or by typing in a value into the box. Make sure to press the enter key when using the text box for entry.
The input control These parameters are changed relative to their control run values. For example, changing a value to 0.95 from 1.00 decreases the parameter by 5%. Water Vapor– Effect of water vapor on the greenhouse effect Solar- How bright the sun is Atm Abs- The amount of sunlight absorbed by the atmosphere R_Atmos- the reflectivity of the atmosphere Lowcloud- The relative amount of low stratus type clouds Highcloud- The relative amount of High thin cloud (like cirrostratus)
The input control Volcanic eruption Volcanic Dust Veil - A relative value indicating the reflectivity of the volcanic dust veil Check box- Check if you want to simulate a volcanic eruption. Eruption year - Time of eruption event.
The input control R_srf is changed relative to its control run value. For example, changing a value to 0.95 from 1.00 decreases the parameter by 5%. R_Srf- the relative Surface reflectivity Ocean Surface Deptt (m) – Depth of the well mixed surface zone in meters. This controls the thermal inertia of the climate system and the time it takes to reach a new equilibrium state after some climate forcing input change.
The input control Check boxes to turn on climate feedback processes. These are not needed for the game assignment.
The input control Press Game1 button for Game 1, …….. The graphical output after pressing Game 3 button. You win the game when you run a simulation that matches this temperature response.
Record all your game results in a single MS word document (or pdf): Include a screen capture of each game’s graphical output with your best fit. Right click on graph and use the” snap shot tool” under “capture the screen”. Also include the specifics of what you had to change in the input controls to “win”. This is not a very good fit but it is getting close. When you have a good fit each final graph should have only two lines on it 1) the game challenge and 2) your best fit. Play all five games for full credit on the assignment.