Efficient Flowchart Diagram for Process Optimization
A flow chart is a sequential diagram illustrating process steps and decisions made, aiding in streamlining tasks. Learn how to use flowchart shapes effectively for documenting processes and improving efficiency.

Efficient Flowchart Diagram for Process Optimization
E N D
Presentation Transcript
Flowchart Diagram Risanuri Hidayat
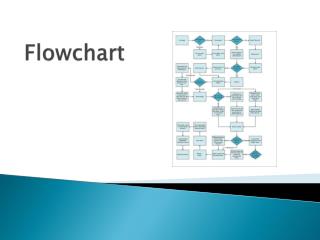
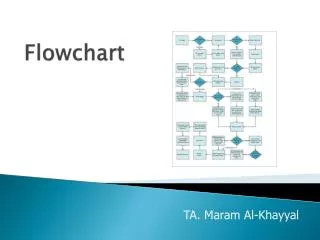
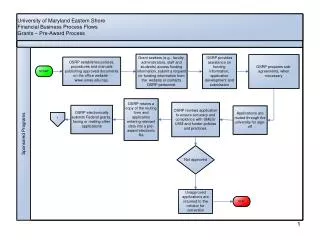
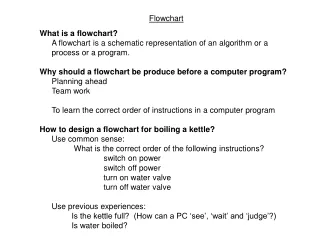
What • A Flow Chart is a sequential diagram that shows the steps involved in an operation or task and the decisions made along the way. • A flowchart illustrates the steps in a process. By visualizing the process, a flowchart can quickly help identify bottlenecks or inefficiencies where the process can be streamlined or improved. • With flow chart diagram, you can graphically document the steps used to complete a task.
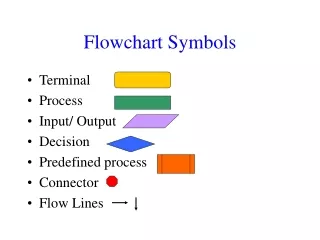
Flowcharting Shapes • Flowcharts use special shapes to represent different types of actions or steps in a process. • Lines and arrows show the sequence of the steps, and the relationships among them.
Shapes • The terminator symbol marks the starting or ending point of the system. It usually contains the word "Start" or "End." Start/End
Shapes • A box can represent a single step ("add two cups of flour"), or and entire sub-process ("make bread") within a larger process. Action/Process
Shapes • A printed document or report. Document
Shapes • A decision or branching point. Lines representing different decisions emerge from different points of the diamond. true ?
Shapes • Represents material or information entering or leaving the system, such as customer order (input) or a product (output). Input/Output
Shapes • Indicates that the flow continues on another page, where a matching symbol (containing the same letter) has been placed. connector
Shapes • Lines indicate the sequence of steps and the direction of flow.
start Input n yes n<1 no F=1.2…(n) n=1 F=1 no yes A Tampilkan F A end Example • Hitung nilai factorial dari x • F(n)= n! = n(n-1)(n-2)…1 • Jika n=1, F(n)=1 • Jika n<1, ditolak
Example • Program ?