Download
1 / 39
710 likes | 1.68k Views
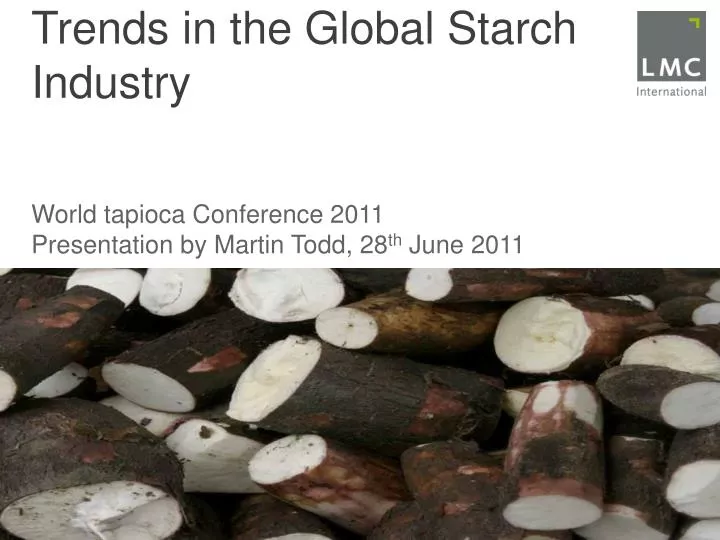
Trends in the Global Starch Industry. World tapioca Conference 2011 Presentation by Martin Todd, 28 th June 2011. Presentation topics Highlighting tapioca’s role in the starch world. Global trends in starch production and trade Development of global starch prices and key drivers

E N D
Trends in the Global Starch Industry World tapioca Conference 2011 Presentation by Martin Todd, 28th June 2011
Presentation topicsHighlighting tapioca’s role in the starch world • Global trends in starch production and trade • Development of global starch prices and key drivers • Dynamics of tapioca starch prices • Challenges for the future
Who are the leading players? Tapioca in South East Asia is very important
Global starch productionPrimary starch vs. native vs. modified • Global more than 70 million tonnes of primary starch are produced to make starches and sweeteners • Of this, around 33 million tonnes is produced and sold as starches • This comprises approximately 25 million tonnes of native starch and 8 million tonnes of modified starch • In this presentation, I will focus on native starch
Tapioca and corn lead the wayCorn starch: 13 million tonnes Tapioca starch: 8 million tonnes Potato: 1.5 million tonnes Wheat: 1.0 million tonnes Global native starch production by type of starch
Tapioca represents more than one third of global production Global native starch production by type of corn starch, average 2008-2010
Several of the world’s top ten starch producers use tapioca as their main raw material Top 10 global native starch producing countries by type of starch, average 2008-2010
More tapioca starch is traded than any other starchTrade in potato starch is also large in relation to output Global native starch exports by type of starch
Tapioca starch makes up about 40% of world starch trade Global native starch exports by type of corn starch, average 2008-2010
Thailand is by far the largest exporter of any single type of starch Top 10 global native starch exporting countries differentiating by type of starch, average 2008-2010
China is the largest importerAnd, tapioca dominates this list Top 10 global native starch importing countries differentiating by type of starch, average 2008-2010
Global trends: conclusions • Corn is the most widely used raw material for starch production • However, traded volumes are limited, because the largest producer (USA) consumes most of its output and has limited outlets because of its GM status • Wheat starch is not widely produced or traded because it is a low quality starch (especially in its native form) • As a result, tapioca and potato starches are traded very heavily in relation to their production
Starch price trends Rising starch prices caused by higher raw material prices
All starch prices show a rising trend over the past ten yearsPotato starch prices have soared in 2011 to >$1,000 Native starch prices, differentiating by type of starch
Tapioca, wheat and potato have all increased relative to corn Native starch prices relative to US corn starch
The reason for rising prices is the upward trend in raw material prices Prices of corn, wheat and tapioca (axes are set to reflect relative starch content of tapioca and grains)
This is true also of net raw material pricesAfter allowing for grain processing by-products Net raw material prices of corn, wheat and tapioca
Net cost of corn has increased by less than the others!This has been reflected in corn starch prices Index of net raw material prices of corn, wheat and tapioca
Price trends: conclusions • Starch prices are rising because of higher raw material prices • US corn starch prices low because of low net corn costs • Despite this, US corn starch has not taken market share because of its GM status • Tapioca starch prices have seen significant price inflation due to high root prices • Potato starch is suffering from this problem this year
Dynamics of tapioca starch prices China’s dominant role
What drives tapioca starch prices? • The key driver is China • China has become increasingly dependent on starch imports, in particular tapioca starch • The link to tapioca starch is through: • China’s starch markets, which is linked to its corn market • China’s ethanol market also influences the starch market via tapioca chips
Meeting China’s demand • China’s starch demand has been growing at an annual rate of more than 10% per annum • And, it will continue to grow very rapidly in the future • But, the government is limiting the use of corn for industrial uses • At the same time, production from other starches is small and will not meet the future growth in demand • So, China’s has become more dependent on imports
China’s tightening grains sector A constraint for starch production China’s corn supply/demand balance
China’s increased dependence on imports China’s native starch supply/demand balance
China has turned to tapioca starch China’s imports of native starch by type of starch
And to Thailand (as well as Vietnam) China’s imports tapioca starch by origin
The result is a link between Chinese corn/starch and SE Asian tapioca Thai tapioca starch prices vs. Chinese corn and corn starch prices
But, cassava starch is a premium starch for functional reasons Chinese prices of Tapioca starch and corn starch
The link also exists between Chinese corn/ethanol and SE Asian tapioca Thai tapioca starch prices vs. Chinese corn and corn ethanol prices
The relationship between corn prices in China and the world (US) is influenced by politics (e.g. 2008, 2010) Chinese corn prices vs. world (US Gulf) prices
Tapioca starch prices are similar throughout SE Asia Tapioca starch prices in Indonesia, Thailand and Vietnam
Price dynamics: conclusions • Tapioca starch prices are linked to China’s corn market via starch and ethanol (and are similar across SE Asia) • Tapioca starch commands a premium over corn starch reflecting its superior qualities as a food starch • China’s corn market does not track the world corn market in the short term because of government intervention
Challenges for the future • China: meeting its demand • EU: where next for potato starch? • Thailand: mealy bug
Will China need more imports?Will corn for industrial use remain restricted?Can tapioca & potato step in? China’s starch supply/demand balance and projected demand ?
EU potato starch: still aliveBut, what will happen after the reforms? EU exports of potato starch by destination
Can Thailand continue to grow?Short run: mealy bugLong run: yields (land is limited in SE Asia) Thai production of tapioca roots How long will this last?
Conclusions • Tapioca starch plays a huge role in world trade and in supplying China’s import needs in particular • As a result, its price dynamics are now linked to China’s corn, starch and ethanol markets • Tightening supply in China’s corn market suggests its imports will continue to grow • Can cassava continue to meet China’s demand? • Land is scarce in SE Asia, so productivity will be key
Thank You www.lmc.co.uk