Download
1 / 38
380 likes | 501 Views
Trigger Angle Dependence of Near- and Away-side Jet Shape with respect to the Reaction Plane at mid-p T region with a special emphasis on Left / Right Asymmetry --- Left / Right Medium Asymmetry w.r.t. Jet Axis ---. ShinIchi Esumi for the PHENIX Collaboration

E N D
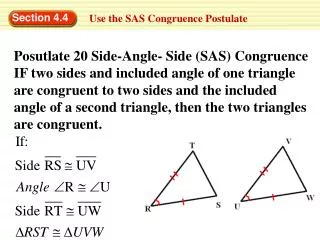
Trigger Angle Dependence of Near- and Away-side Jet Shape with respect to the Reaction Plane at mid-pT region with a special emphasis on Left / Right Asymmetry --- Left/ Right Medium Asymmetry w.r.t. Jet Axis --- ShinIchi Esumi for the PHENIX Collaboration Inst. of Physics, Univ. of Tsukuba esumi@sakura.cc.tsukuba.ac.jp
Previous results #1 QM04: STAR QM08: STAR, PHENIX STAR 3<pTtrig<4GeV/c & 1.0<pTasso<1.5GeV/c 20-60% = associate - trigger (rad)
Au+Au, 200 GeV “jet” STAR Ridge Dh Df(rad) Previous results #2 away side (in d) of one di-jet can be near side (in d) of another di-jet QM08 STAR 3<pTtrig<4, 1.5<pTtrig<2.0 GeV/c Ridge STAR Preliminary Jet
ASSO-TRIG<0 -p 0 p ASSO TRIG New Idea near side (trigger direction) thin side mach-cone (shoulder region) ASSO-TRIG>0 Trigger angle selected with respect to the 2nd moment event plane [-p/2,p/2] to probe the participant geometry away side (head region) mach-cone (shoulder region) ASSO-TRIG<0 thick side If trigger angle is fixed around +/-(p/4), the associate particles emitted left or right w.r.t. trigger direction would feel the different thickness of the almond. It is because the almond shaped medium is asymmetric w.r.t. jet axis. turn the page!
out-of-pl. in-pl. in-pl. out-of-pl. Understanding of Mach-cone shape of (pTAsso=1~2GeV/c) with trigger angle selected 2-particle correlration (pTTrig=2~4GeV/c) trigger associate angle ASSO.-TRIG. < 0 associate angle ASSO.-TRIG. > 0 trigger under the prev. page
(1) (8) (2) (7) (6) (3) (4) (5) (5) (4) (6) (3) (7) (2) (8) (1) Analysis methods RUN7, Au+Au 200GeV 30-40%, h-h 2 < pTtrig. < 4GeV/c 1 < pTasso. < 2GeV/c C2 = (Real pair) / (Mixed pair) J = C2data - C2mc before flow subtraction after flow subtraction (4) (5) (3) (6) (4) (5) (3) (6) Curves are normalized with data at fixed Df regions around +/-1. (asso.) - (trig.) Colored lines are expected flow curves, which are given by MC with measured v2,v4 and R.P. resolution. Black lines are reference curves, which are given by the average of all (1)~(8) data. turn the page!
(1) (8) (2) (7) (6) (3) (4) (5) (5) (4) (6) (3) (7) (2) (8) (1) RUN7, Au+Au 200GeV 30-40%, h-h Analysis methods 2 < pTtrig. < 4GeV/c 1 < pTasso. < 2GeV/c in-plane C2 = (Real pair) / (Mixed pair) J = C2data - C2mc CASE.A - Random R.P. for mixed event - No trigger angle selection in mixed pair CASE.B - Same R.P. for mixed event bin [cent:10, zvtx:10, r.p.:50] - Same trigger angle selection in mixed pair CASE.A CASE.B Solid black lines are same as the bottom average data. (4) (5) (3) (6) (2) (7) (1) (8) av (4) (5) (3) (6) (2) (7) (1) (8) av (4) (5) (3) (6) (2) (7) (1) (8) av C2mc : Lines in the left two figures are given by MC with measured v2, v4 and RP, and are normalized to data at the fixed d region. Subtractions are done in smaller pT bin steps, merging them after the subtraction PHENIX preliminary (asso.) - (trig.) under the prev. page
(1) (8) (2) (7) (3) (6) (4) (5) (5) (4) (6) (3) (7) (2) (8) (1) correlation functions before the flow subtraction 10-15% 40-50% 70-93% (5) (4) in-plane in-plane (6) (3) in-plane (7) (2) C2 = (Real pair) / (Mixed pair) (8) (1) out-of-plane out-of-plane average average PHENIX preliminary Asso.Trig. (rad) turn the page!
0-5% 10-15% 20-30% 40-50% 50-60% 60-70% 70-93% random R.P. mixing C2 = (Real pair) / (Mixed pair) correlation functions before the flow subtraction in two different ways of mixing aligned R.P. mixing PHENIX preliminary Asso.Trig. (rad) under the prev. page
(1) (8) (2) (7) (3) (6) in-plane (4) (5) (5) (4) (6) (3) (7) (2) (8) (1) Results #1 (mid-central) 200GeV Au+Au -> h-h (run7) (pTTrig=2~4GeV/c, pTAsso=1~2GeV/c) mid-central : 20-50% left/right asymmetry (5) s=[0,1]/8 (4) s=[-1,0]/8 left right c2(data) - c2(flow) left right s = Trig. R.P. [] in-plane associate regions PHENIX preliminary Asso.Trig. (rad) turn the page!
(1) (8) (2) (7) (3) (6) in-plane (4) (5) (5) (4) (6) (3) (7) (2) (8) (1) Results #2 (mid-central) left/right asymmetry 200GeV Au+Au -> h-h (run7) (pTTrig=2~4GeV/c, pTAsso=1~2GeV/c) mid-central : 20-50% (6) s=[1,2]/8 (3) s=[-2,-1]/8 c2(data) - c2(flow) left right left right s = Trig. R.P. [] in-plane associate regions PHENIX preliminary Asso.Trig. (rad) under the prev. page
(1) (8) (2) (7) (3) (6) in-plane (4) (5) (5) (4) (6) (3) (7) (2) (8) (1) Results #3 (mid-central) left/right asymmetry 200GeV Au+Au -> h-h (run7) (pTTrig=2~4GeV/c, pTAsso=1~2GeV/c) mid-central : 20-50% (7) s=[2,3]/8 (2) s=[-3,-2]/8 left c2(data) - c2(flow) right left right s = Trig. R.P. [] in-plane associate regions PHENIX preliminary Asso.Trig. (rad) under the prev. page
(1) (8) (2) (7) (3) (6) in-plane (4) (5) (5) (4) (6) (3) (7) (2) (8) (1) Results #4 (mid-central) left/right asymmetry 200GeV Au+Au -> h-h (run7) (pTTrig=2~4GeV/c, pTAsso=1~2GeV/c) mid-central : 20-50% (8) s=[3,4]/8 (1) s=[-4,-3]/8 left c2(data) - c2(flow) right left right s = Trig. R.P. [] in-plane associate regions PHENIX preliminary Asso.Trig. (rad) under the prev. page
(1) (8) (2) (7) (3) (6) in-plane (4) (5) (5) (4) (6) (3) (7) (2) (8) (1) 200GeV Au+Au -> h-h (run7) (pTTrig=2~4GeV/c, pTAsso=1~2GeV/c) mid-central : 20-50% (4) s=[-1,0]/8 (5) s=[0,1]/8 in-plane trigger selection (3) s=[-2,-1]/8 (6) s=[1,2]/8 in-plane associate regions c2(data) - c2(flow) (2) s=[-3,-2]/8 (7) s=[2,3]/8 s = Trig. R.P. [] (1) s=[-4,-3]/8 (8) s=[3,4]/8 Results #1~4 out-of-plane trigger selection Trigger angle selected curves are shifted up by constant offsets, dashed average lines are overlaid. average PHENIX preliminary turn the page! Asso.Trig. (rad)
200GeV Au+Au -> h-h (run7)(pTTrig=2~4GeV/c, pTAsso=1~2GeV/c) central : 0-20% mid-central : 20-50% peripheral : 50-93% (5) (4) (6) (3) (7) (2) average out-of-plane in-plane (8) (1) Black dashed line is same as the bottom average. PHENIX preliminary Asso.Trig. (rad) under the prev. page
(1) (8) (2) (7) (3) (6) in-plane (4) (5) (5) (4) (6) (3) (7) (2) (8) (1) blue data points are flipped. 200GeV Au+Au -> h-h (run7) (pTTrig=2~4GeV/c, pTAsso=1~2GeV/c) mid-central : 20-50% (5) s=[0,1]/8 in-plane trigger selection (6) s=[1,2]/8 in-plane associate regions c2(data) - c2(flow) (7) s=[2,3]/8 s = Trig. R.P. [] (8) s=[3,4]/8 For negative trigger angle selections (1) ~ (4), are flipped, where is plotted for blue data, so that they should overlap with positive trigger selections because of the expected mirror symmetry. out-of-plane trigger selection average PHENIX preliminary turn the page! Asso.Trig. (rad)
200GeV Au+Au -> h-h (run7)(pTTrig=2~4GeV/c, pTAsso=1~2GeV/c) central : 0-20% mid-central : 20-50% peripheral : 50-93% blue data points are flipped. (5) (6) (7) average out-of-plane in-plane (8) PHENIX preliminary Asso.Trig. (rad) under the prev. page
Summary Data for Left/right asymmetry 200GeV Au+Au -> h-h (run7) (pTTrig=2~4GeV/c, pTAsso=1~2GeV/c) central : 0-20% mid-central : 20-50% peripheral : 50-93% c2(data) - c2(flow) in-plane (5) : s=[0,1]/8 middle (6) : s=[1,2]/8 out-of-plane (8) : s=[3,4]/8 Asso.Trig. (rad) PHENIX preliminary
FNear FAway+ Faway Asso.Trig. (rad) 200GeV Au+Au -> h-h (run7) (pTTrig=2~4GeV/c, pTAsso=1~2GeV/c) mid-central : 20-50% (4) s=[-1,0]/8 (5) s=[0,1]/8 in-plane trigger selection (3) s=[-2,-1]/8 (6) s=[1,2]/8 c2(data) - c2(flow) (2) s=[-3,-2]/8 Fitting with 3 Gaussian functions Gauss function : F(height, mean, width) FNear(A0, D0, S0) + FAway+(A+ , D+ , S+) + FAway(A, D, S) | D+ | = | D| , S+= S (7) s=[2,3]/8 (1) s=[-4,-3]/8 (8) s=[3,4]/8 out-of-plane trigger selection Fitted data with 3 Gauss func. average PHENIX preliminary turn the page! Asso.Trig. (rad)
200GeV Au+Au -> h-h (run7)(pTTrig=2~4GeV/c, pTAsso=1~2GeV/c) central : 0-20% mid-central : 20-50% peripheral : 50-93% (5) (4) (6) (3) (7) (2) average out-of-plane in-plane (8) (1) PHENIX preliminary Asso.Trig. (rad) under the prev. page
(1) (8) (2) (7) (3) (6) FNear in-plane (4) (5) FAway+ Faway (5) (4) (6) (3) Asso.Trig. (rad) (7) (2) (8) (1) (A+ A) (A+ + A) 0.5 Results on fitting parameters near side peak position left/right asymmetry D0 (rad) Fitting with 3 Gaussian functions Gauss function : F(height, mean, width) FNear(A0, D0, S0) + FAway+(A+ , D+ , S+) + FAway(A, D, S) | D+ | = | D| , S+= S 20 ~ 50 % s = Trig. R.P. [] -ve Df near shifted consistent with page4 picture away side shoulder height left/right asymmetry away side shoulder peak position 200GeV Au+Au (run7) hadron-hadron (pTTrig=2~4GeV/c, pTAsso=1~2GeV/c) | D+/- | (rad) +ve Df away enhanced PHENIX preliminary s = Trig.R.P. (rad) turn the page!
(1) (8) (2) (7) FNear (3) (6) FAway+ Faway in-plane (4) (5) (5) (4) Asso.Trig. (rad) (6) (3) (7) (2) (8) (1) (A+ A) (A+ + A) 0.5 Results on fitting parameters Gauss function : F(height, mean, width) FNear(A0, D0, S0) + FAway+(A+ , D+ , S+) + FAway(A, D, S) | D+ | = | D| , S+= S near side peak position left/right asymmetry S0 A0 Trig.R.P. [] 0 ~ 20 % 20 ~ 50 % 50 ~ 93 % D0 away side shoulder height left/right asymmetry away side shoulder peak position 0.5(A+ + A) S | D+/-| Trig.R.P. (rad) PHENIX preliminary under the prev. page
Experimental Summary (1) modification of mach-cone like away-side shape centrality dependence was known (2) in-plane/out-of-plane dependence was also known (3) left/right asymmetry of near- and away-side shape (new), this gives a constrain to the mach-cone models (4) implication to the inclusive v2 and/or “true” jet bias on v2 as well as eve-by-eve v2 fluctuation, positive impact on v2 from both (2) and (3). (5) There is no experimental way to distinguish whether this asymmetry is caused by geometrical suppression or by dynamical elliptic expansion. The result tells us they are strongly coupled. Simulation comparison slides continue …
(1) (8) (2) (7) (6) (3) (4) (5) (5) (4) (6) (3) (7) (2) (8) (1) AMPT AMPT (v1.11, parton cascade with string melting v2.11) Au+Au at sqrt(sNN)=200GeV Similar trend as seen in experiment (true) reaction plane aligned correlation function trend is reversed 4~18% b = 3.5~7 (fm) 44~% b = 10.5~ (fm) Asso.Trig. (rad) with trigger angle selected w.r.t. R.P. perfect R.P. resolution no v2 subtraction needed turn the page!
AMPT AMPT (v1.11, parton cascade with string melting v2.11) Au+Au at sqrt(sNN)=200GeV central peripheral Trig.R.P. > 0 (open symbols) Trig.R.P. < 0 (filled symbols) (true) reaction plane aligned correlation function average out-of-plane in-plane 0~4% b = 0~3.5 (fm) 4~18% b = 3.5~7 (fm) 18~44% b = 7~10.5 (fm) 44~% b = 10.5~ (fm) Asso.Trig. (rad) with trigger angle selected w.r.t. R.P. perfect R.P. resolution no v2 subtraction needed under the prev. page
Bin 5 Near peak Mach cone 1 Bin 0 Mach cone 2 J.Jia, R.Wei, S.E arXiv:0903.3263 Energy loss and/or absorption model Eloss depending on angle w.r.t. R.P. for near peak and Mach cone 1/2 The multiplicities in these regions are assumed to be proportional to the path length (a la energy loss). Note: original jets are generated according to Ncoll profile cone1 cone2 ASSO TRIG (rad) turn the page!
kT smearing included, modified mach-cone by absorption according to Eloss. The asymmetry is now flipped. cone1 cone2 J.Jia, R.Wei, S.E arXiv:0903.3263 Energy loss and/or absorption model If the multiplicities reduces with the path length because of absorption... Note: original jets are generated according to Ncoll profile ASSO TRIG (rad) punch through jets included, smeared with R.P. resolution under the prev. page
(1) (8) (2) (7) (3) (6) (4) (5) (5) (4) (6) (3) (7) (2) (8) (1) Simulation Study trigger particle ASSO TRIG ) > 0 (5) (4) (6) (3) (2) (7) (8) (1) ASSO TRIG ) < 0 ASSO TRIG (rad) Assume very strong R.P. dependence on jet shape. This will NOT be a pure non-flow. Since the assumed modification here always prefer in-plane emission than out-of-plane emission, which could be given by geometry or by elliptic expansion (azimuthal dependence of radial flow). This could also be a strong contribution to v2 depending on the relative yield and the magnitude of the shape modification. ZYAM level might also be different from left/right averaged one. shape(1) = f1(x) shape(2) = f2(x) shape(3) = f3(x) shape(4) = f4(x) shape(5) = f5(x) =f4(-x) shape(6) = f6(x) =f3(-x) shape(7) = f7(x) =f2(-x) shape(8) = f8(x) = f1(-x) 3 x (peak, left and right width) + 2 x relative height = 11 par turn the page!
(1) (8) (2) (7) (3) (6) in-plane (4) (5) (5) (4) (6) (3) (7) (2) (8) (1) Simulation random R.P. mixing (total flow + jet) 1.4 in-plane out-of-plane averaged before subtraction 1.0 ASSO TRIG (rad) 2-particle correlation : before subtraction aligned R.P. mixing (reduced flow + jet) in-plane out-of-plane averaged 1.1 before subtraction 1.0 ASSO TRIG (rad) under the prev. page
(1) (8) (2) (7) (3) (6) in-plane (4) (5) (5) (4) (6) (3) (7) (2) (8) (1) Simulation random R.P. mixing (total flow subtracted jet) in-plane out-of-plane averaged 0.1 after subtraction 0.0 ASSO TRIG (rad) 2-particle correlation : after subtraction aligned R.P. mixing (reduced flow subtracted jet) in-plane out-of-plane averaged 0.1 after subtraction 0.0 ASSO TRIG (rad) under the prev. page
Simulation comparison between input and output in-plane out-of-plane input perfect R.P. resolution (res~1) output experimental R.P. resolution (res~0.7) output ASSO TRIG (rad) turn the page!
Simulation effect of the experimental resolution res~1 res~0.9 res~0.7 res~0.5 no R.P. bias from jet-correlation ASSO TRIG (rad) R.P. biased by jet-correlation ASSO TRIG (rad) under the prev. page
Simulation 4 different jet shape assumptions for MC input jet shape #2 jet shape #3 jet shape #4 jet shape #1 no R.P. dependence near- and away- side dependence only away-side dependence only near-side dependence ASSO TRIG (rad)
Simulation Comparison with data would tell us that there should be near- and away-side modification in experimental data. nTrig /eve (soft) = 3 nAsso /eve (soft) = 8 nJet /eve (hard) = 1 nPTY /jet (hard) = 1.25 v2,4Trig (soft) = 0.2, 0.029 v2,4Asso (soft) = 0.13, 0.010 v2,4Jet (hard) = 0.2, 0.0 v2,4PTY (hard) = 0.15, 0.0 jet shape #2 jet shape #3 jet shape #4 jet shape #1 There should also be a strong effect on v2 , much stronger effect on v4. v2(high)=0.20 ---> 0.20 v4(high)=0.029 ---> 0.022 v2(low)=0.13 ---> 0.15 v4(low)=0.010 ---> 0.016 v2(high)=0.20 ---> 0.20 v4(high)=0.029 ---> 0.022 v2(low)=0.13 ---> 0.14 v4(low)=0.010 ---> 0.014 v2(high)=0.20 ---> 0.20 v4(high)=0.029 ---> 0.022 v2(low)=0.13 ---> 0.13 v4(low)=0.010 ---> 0.012 v2(high)=0.20 ---> 0.20 v4(high)=0.029 ---> 0.022 v2(low)=0.13 ---> 0.12 v4(low)=0.010 ---> 0.009 ASSO TRIG (rad) turn the page!
Simulation nTrig /eve (soft) = 3 nAsso /eve (soft) = 8 nJet /eve (hard) = 1 nPTY /jet (hard) = 1.25 v2,4Trig (soft) = 0.2, 0.029 v2,4Asso (soft) = 0.13, 0.010 v2,4Jet (hard) = 0.0, 0.0 v2,4PTY (hard) = 0.0, 0.0 jet shape #2 jet shape #3 jet shape #4 jet shape #1 v2(high)=0.20 ---> 0.15 v4(high)=0.029 ---> 0.022 v2(low)=0.13 ---> 0.14 v4(low)=0.010 ---> 0.015 v2(high)=0.20 ---> 0.15 v4(high)=0.029 ---> 0.022 v2(low)=0.13 ---> 0.13 v4(low)=0.010 ---> 0.014 v2(high)=0.20 ---> 0.15 v4(high)=0.029 ---> 0.022 v2(low)=0.13 ---> 0.12 v4(low)=0.010 ---> 0.011 v2(high)=0.20 ---> 0.15 v4(high)=0.029 ---> 0.022 v2(low)=0.13 ---> 0.11 v4(low)=0.010 ---> 0.009 ASSO TRIG (rad) under the prev. page
Yet another way of looking at the same data, “jet and event shape” correlation. Simulation Input parameters (1) Jet shape (11x4) (2) v2,4Trig (soft) (3) v2,4Asso (soft) (4) v2,4Jet (hard) (5) v2,4PTY (hard) (6) nTrig /eve (soft) (7) nAsso /eve (soft) (8) nJet /eve (hard) (9) nPTY /jet (hard) Output parameters (a) v2,4Trig (incl) (b) v2,4Asso (incl) (c) nTrig /eve (incl) (d) nAsso /eve (incl) (e) hard/soft frac. (true frac.) (zyam frac.) input jet shape Input jet + flow in-plane out-of-plane AssoR.P. (trigger angle Trig selection w.r.t. R.P., where Trig gives the sign of 2nd order R.P. ) turn the page!
Simulation mixed event flow-subtraction with perfect resolution mixed event flow-subtraction with experimental resolution no flow-subtraction AssoR.P. (trigger angle Trig selection w.r.t. R.P., where Trig gives the sign of 2nd order R.P. ) under the prev. page
Simulation/Comparison Summary (1) AMPT does show an interesting asymmetry, which is similar in peripheral region, but it has an opposite (left/right) trend in mid-central region (not discussed in arXiv:0903.2165). Jet shape modification gives a positive impact on v2 at peripheral and a negative impact on v2 at mid-central in AMPT, while experimental data do show mostly a positive impact on v2. Special thanks to C.M.Ko et. al. (2) Jet energy-loss and/or suppression model also shows an asymmetry that can be given by almond shape geometry and some attenuation or absorption of mach-cone (arXiv:0903.3263). Special thanks to J.Jia, R.Wei. (3) Strong interplay between jet-modification and v2, v4 and strong smearing of the measured shape by the reaction plane resolution are expected based on the toy model simulation, which also implies jet bias on the inclusive v2 , v4 and eve-by-eve v2 fluctuation. (This is a true bias, which is different from the one so called “physics auto-correlation” via R.P.)