Download
1 / 15
150 likes | 276 Views
Identification of Lines in the Range 3. 3 Å - 6.1 Å Observed in RESIK Spectra. B. Sylwester, J. Sylwester, M. Siarkowski Space Research Centre, Polish Academy of Sciences, Wrocław, Poland K.J.H. Phillips NASA Goddard Space Flight Center, Greenbelt, USA L. Culhane

E N D
Identification of Lines in the Range 3.3 Å - 6.1 Å Observed in RESIK Spectra B. Sylwester, J. Sylwester, M. Siarkowski Space Research Centre, Polish Academy of Sciences, Wrocław, Poland K.J.H. Phillips NASA Goddard Space Flight Center, Greenbelt, USA L. Culhane Mullard Space Science Laboratory, Dorking, Surrey, UK J. Lang Rutherford Appleton Laboratory, Chilton, Didcot, UK C. Brown Naval Research Laboratory, Washington DC, USA V.D. Kuznietsov IZMIRAN, Moscow region, Troitsk, Russia 35th COSPAR: Scientific Commission E1.9; Paris, 18-25 July 2004
INTRODUCTION RESIK is a common project between NRL (USA), MSSL and RAL (UK), IZMIRAN (Russia)and SRC (Poland). It is Bragg bent crystal X-ray spectrometer placed aboard the CORONAS-F satellite. The wavelength coverage of RESIK is 3.3 Å ÷6.1 Å (four energy channels). Preliminary analysis of spectra collected indicates presence of many spectral features identified earlier in the flaring plasmas and corresponding to the transitions1s-2p in H-like ions and 1s2-1s2p in He-like ions of S and Si.In addition many prominent lines not earlier observed can be identified in RESIK spectra. We have calibrated the spectra, establishing an absolute wavelength scale and determining the absolute photon fluxes. This made it possible to identify several spectral features, some of which are observed for the first time from astrophysical plasmas. In particular we have detected lines due to highly ionized potassium and chlorine. Potassium belongs to very low FIP elements (4,31 eV) whilechlorine to high ones (12.97 eV). 35th COSPAR: Scientific Commission E1.9; Paris, 18-25 July 2004
http://www.cbk.pan.wroc.pl/resik_catalogue.htmhttp://www.cbk.pan.wroc.pl/legend/legend_2003.htmhttp://www.cbk.pan.wroc.pl/resik_catalogue.htmhttp://www.cbk.pan.wroc.pl/legend/legend_2003.htm 35th COSPAR: Scientific Commission E1.9; Paris, 18-25 July 2004
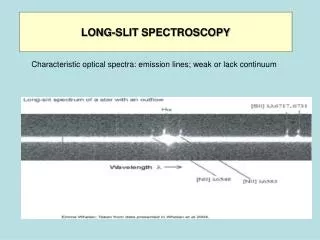
Example spectra As an example of RESIK observations in the two successive slides, we present the spectra recorded for a moderate disk(N16W05) flare of C5.8 class. It was a short duration event observed over its entire duration. The spectrum filled in GREEN is the original one (counts vs bin numbers) while in BLUE corresponds to the absolute calibration (photons vs Å). The individual channels are presented in different blue semi-tones: 3.35 - 3.8 - 4.3 - 4.9 -6.0 Å. 35th COSPAR: Scientific Commission E1.9; Paris, 18-25 July 2004
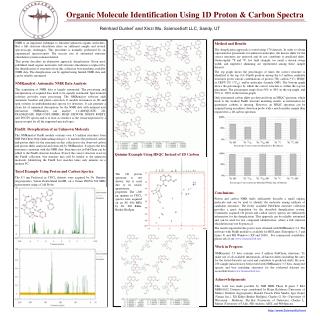
Ar XVII S XV S XV-3p S XVI S XV-4p ? K XVIII Cl ? ? Si XIII-3p Cl ? RESIK background corrected spectrum (C5.8 flare on 22 Feb.2003) Spectrum integrated over the event duration (584 s).Red arrows indicate for Cl H- and He-like line positions. Red? indicate for unidentified lines. Ar XVII 3p Ar XVI 35th COSPAR: Scientific Commission E1.9; Paris, 18-25 July 2004
S XV-2p Si XII Si XIV S XVI-2p Si XIII S XV-3p Ar XVII K XVIII S XV-4p Si XIII-3p Cl XVI (R,I,F) Cl XVII (Lyα) Reduced RESIK spectrum for (entire) flare on 22 Feb. 2003 Ar XVIII The spectrum has been integrated over the flare duration – 584 sec. The individual channels are presented in different blue semi-tones. 35th COSPAR: Scientific Commission E1.9; Paris, 18-25 July 2004
Distribution of activity during 1 January – 14 March 2003 We have analysed here the RESIK spectra collected between 1 January and 14 March2003. During this period 1163 time intervals have been chosen for which the spectra have been measured. The collected set of spectra covers as well very low activity level (~B4) as few M class flares. No single X class flare has been reported during analysed period. 35th COSPAR: Scientific Commission E1.9; Paris, 18-25 July 2004
Data analysis Using the ratio of total (lines+continuum)fluxes measured in the most energetically separated RESIK channels (#1 and #4) in the regions (3.4 -3.8 Å) and (5.0 – 6.05 Å)respectivelywe have calculated the temperature and emission measure (in an isothermal approximation) for all analysed cases. This in turn allowed us to calculate the expected continuum level and subtract it from the observed spectrum in order to better see the lines. 35th COSPAR: Scientific Commission E1.9; Paris, 18-25 July 2004
RESIK average spectrum for 1 January – 14 March 2003 period SGI = 388.6 hours (1163 cases added) 35th COSPAR: Scientific Commission E1.9; Paris, 18-25 July 2004
The same in logarithmic scale 35th COSPAR: Scientific Commission E1.9; Paris, 18-25 July 2004
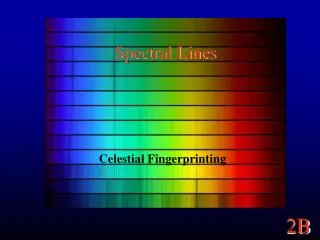
Average spectra grouped according to the temperature K XVIII 2p Ar XVIII 2p (Lyα) S XV 4p S XIV sat We averaged the observed spectra in individual groups characterised by different temperatures. 35th COSPAR: Scientific Commission E1.9; Paris, 18-25 July 2004
Average spectra grouped according to the temperature Si XIV 3p Lyβ S XIV sat S XV 3p Si XIII sat Si XIII 3p Poster P 0108 35th COSPAR: Scientific Commission E1.9; Paris, 18-25 July 2004
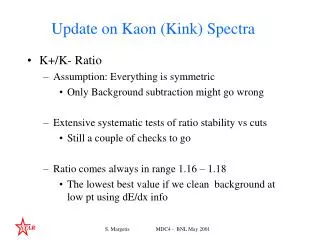
Channel 1 and 2 averaged RESIK spectra Ar XVII w,x,y,z S XV 3p S XVI 6p S XV 4p Ar XVII 3p S XIV sat Ar XVIII 2p K XVIII w,x,y,z S XIV sat ? ? ? S XVI 4p S XVI 5p Ar XVI sat Poster0112 35th COSPAR: Scientific Commission E1.9; Paris, 18-25 July 2004
Channel 3 and 4 averaged RESIK spectra Si XIII 3p S XV w,x,y,z S XV 3p Si XIV 3p Si XII sat S XVI 2p Cl XVI w,x,y,z Al XIII 3p Si XIII 5p Si XII sat ? Si XIII 4p Si XIV 6p S XIV sat Si XIV 8p ? Si XIV 5p Al XIII 4p Al XIII 5p 35th COSPAR: Scientific Commission E1.9; Paris, 18-25 July 2004
What can be done with RESIK uniqueobservations Determination of chemical composition of X-ray flare and active region plasma with a high precision using emission line and continuum intensities (K, Ar, Cl, S, Si, Al). FIP dependence analysis of absolute coronal abundances: FIP (eV): 4.31 5.99 8.15 10.36 11.97 15.76 element: K Al Si S Cl Ar Differential emission measure analysis (DEM)-determination of the temperature structure of emitting regions. The RESIK range includes many strong emission lines due to transitions 1s-np and 1s2-1snp in H-like and He-like ions respectively. The lines corresponding to the transitions for n = 2 and 3 are routinely observed for Si, S and Ar ions. For some flares we observe the enhanced emission in spectral features coinciding with these transitions for n up to 9 or 10. (The analysis of observed line seriesdecrements.) 35th COSPAR: Scientific Commission E1.9; Paris, 18-25 July 2004