Download
1 / 46
460 likes | 677 Views
Chapter 14 Real-Options Analysis for Knowledge Valuation. The Knowledge Management Toolkit Amrit Tiwana. The Limitation of Traditional Metrics. Financial ROI and Tobin ’ s Q Total Cost of Ownership Lessons from the Telephone. Financial ROI and Tobin ’ s Q.

E N D
Chapter 14Real-Options Analysis for Knowledge Valuation The Knowledge Management Toolkit Amrit Tiwana
The Limitation of Traditional Metrics • Financial ROI and Tobin’s Q • Total Cost of Ownership • Lessons from the Telephone
Financial ROI and Tobin’s Q • Tobin’s q essentially measures the ration between the firm’s market valuation and the cost of replacing its physical assets. • Tobin’s q does not tell a firm how it can create further value, prevent imitation or substitution, and leverage its knowledge assets to gain a sustainable competitive advantage.
Total Cost of Ownership • It leaves out significant cost categories, such as complexity costs. • It ignores benefits beyond pure costing. • It neglects strategic factors. • It provides little or no basis for comparison with other department and other companies, such as competing firms operating in the same markets. • Life cycle costs are difficult to gauge.
Lessons from the Telephone • Just as a telephone is hard to cost-justify and evaluate, KM is something firms often find difficult to cost-justify in the face of other need investments but is something they want and should have. • Even though middle managers feel the need for a strong KM initiative, convincing senior management to shell out the couple of million dollars for an initiative with intangible results can be hard sell.
Common Traps In Choosing Metrics • No metrics is better than one that is absolutely wrong. • A choice of a wrong metric can have more ill effects than positive ones. • Metrics, when applied to knowledge work or in general, are vulnerable.
Trap1: Using Too Many Metrics • A few robust metrics are better than a number of marginally ones. • They need to focus on the past, present, and future simultaneously to be able to relate past performance, present processes, and future results. • Use 20 as a cutoff rule of thumb number for the few but essential metrics that can be simultaneously tracked.
Trap 2: the Consequences of Delayed Rewards • Delayed rewards will only bias employees to work toward metrics that deliver short-term payoffs to them.
Trap 3: Metrics That Are Hard to Control • Companies often make the grave mistake of implementing metrics that are beyond the control of their employees.
Trap 4: Metrics That tear People away from Business Goal • The key idea is that the metrics that you select must encourage individual decisions that also move your company in the same directions as its long-term goals. • Some metrics might seem reasonable, but when they are put into action, they result in counterproductive consequences.
Agency-Agent Conflicts • A manager or employee will maximize the metrics that are actually measured. • If a manager is told that a high market share for a product, even thoug quality (not measured) might be equally important.
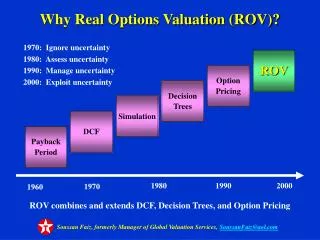
Real-options analysis • The strength of options-based analysis lies in its ability to account explicitly for the value of flexibility for which traditional metrics cannot account. • This approach befriends uncertainty that other approach fear. • This approach also encourages managers to think of every investment in KM as an initial investment against a unexpected innovation, or regulatory change.
The option space • A KM project results in an initial cost that is fixed and irrecoverable. In addition, each increment adds some variable cost to the picture (figure 14-3).
The option space • The ratio of the net value to the sum total of such costs for each independent and decomposable investment is the starting point for options-based analysis.
The option space • The option space can further be divided into a half-dozen segments that represent relative differences, compared with the adjacent segments.
KM investment as portfolio of options • A series of investment in a KM initiative can be though of as a series of options that build toward a portfolio. Each investment might have a different level of risk, strategic intent, and time to fruition, as Figure 14-6 illustrates. • The goal is to nurture and manage a KM initiative as portfolio of well-balanced investments. • Real-options analysis can allow manager to think several moves ahead of their present investments.
Measuring Inputs for Real-Options Models • Benchmarking. • The Benchmarking Process • Benchmark Lessons • House of Quality and Quality Function Deployment • The Balanced Scorecard Technique
Benchmarking • Many large firms have adopted benchmarking as a significant, systematic technique for measuring the company’s performance toward its strategic goals.
Benchmarking • Benchmarking can also provide insights into areas such as: • Overall productivity of knowledge investments • Service quality • Customer satisfaction and operational level of customer service • Time to market in relation to other competitors • Costs, profits, and margins • Relationships and relationship management
Benchmarking • The wise learn many things from their enemies • By benchmarking your own business against your competitor’s, you get information on how to tweak your company’s performance goals to stay competitive, in relation to your competitors.
Benchmarking • Benchmark Targets • Table 14-1 summarizes possible targets against you can benchmark your company’s KM initiatives.
The Benchmarking Process • On the lines of Xerox’s benchmarking program, Spendolini has suggested a five-step procedure for benchmarking efforts. An adaptive version of this process applied to knowledge work is shown in Figure 14-8. • The benchmarking process can be used for self-comparison, as well.
Benchmark Lessons • Make it valuable. • Make it rare. • Make it hard to copy. • Make it hard to substitute.
House of Quality and Quality Function Deployment • The House of Quality approach was developed by Hauser and Clausing in an original paper that appeared in the Harvard Business Review. • The use of this technique is commonly referred to as Quality Function Deployment (QFD).
House of Quality Metrics Matrix • Be careful to select outcome that are clearly observable without much delay. • Examples of such outcomes include: • Improve knowledge sharing to a level where 20% of an average employee’s work is based on existing knowledge • Speed up problem solving by a factor of 5% over the next six months • Improve quality such that the rate of failure of product X decrease by 15% within the next 12 months • Generate more conversation among employees • Increase customer satisfaction level by 50%
The Balanced Scorecard Technique • The Balance Scorecard provides a technique to “maintain a balance between long-term and short-term objectives, financial and nonfinancial measures, lagging and leading indicators and between internal and external perspectives.”
The KM Balance Scorecard • Translate the KM vision • Communicate and link • Do a reality check • Incorporate learning and feedback
Advantages of KM balanced scorecards • The ability to provide a snapshot of the intellectual health of your firm at any point in time. • Built-in cause-and-effect relationships that can help you guide your KM strategy. • A sufficient number of performance drivers and metrics. • Capability to communicate the KM strategy throughout the firm. • Capability to link individual goals with the overall knowledge strategy of the firm
Advantages of KM balanced scorecards • A direct, and often missing link between long-term knowledge and competence goals of the firm and its annual budget. • Translation of the lofty visions of a firm into more doable, realistic, manageable, and specific performance goals. • Logical integration into the overall strategy of your business while still making sense.
Advantages of KM balanced scorecards • Objective measurement of the contribution of knowledge to the more intangible source of competitive advantage, such as customer satisfaction and employee skills and competencies. • A direct link to financial measures and your KM system’s effect on the company bottom line.
Limitations of KM Balanced Scorecards • On the downside, a well-designed Balance Scorecard is more difficult to develop than a similar quality function (QFD) model. • It is rarely possible to adopt directly another firm’s Balance Scorecard because subtle differences exist even between very similar firms.
Alternative Metrics • The Skandia Method. • The FASB Method.