Download
1 / 1
10 likes | 81 Views
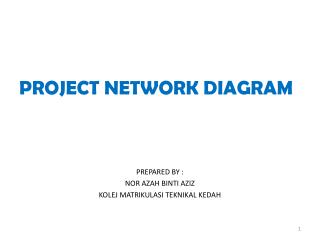
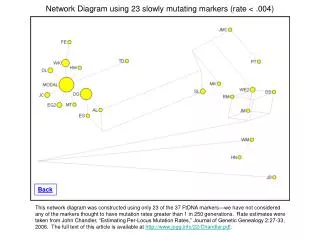
This network diagram is created with 23 markers showing low mutation rates. Excludes markers with rates above 1 in 250 generations. Based on John Chandler's research. For more details, refer to the provided link.

E N D
Network Diagram using 23 slowly mutating markers (rate < .004) Back This network diagram was constructed using only 23 of the 37 FtDNA markers—we have not considered any of the markers thought to have mutation rates greater than 1 in 250 generations. Rate estimates were taken from John Chandler, “Estimating Per-Locus Mutation Rates,” Journal of Genetic Genealogy 2:27-33, 2006. The full text of this article is available at http://www.jogg.info/22/Chandler.pdf.