Download
1 / 17
170 likes | 273 Views
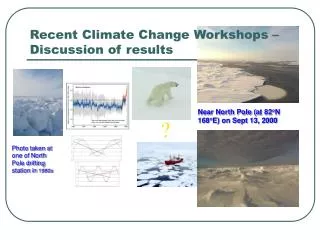
Explore the impact of non-linearities in climate change contributions and the indicators used to describe them. Learn the cause-effect chain from emissions to temperature change, radiative forcing, and damages. Discover the importance of historical emissions and how certain indicators offer insight into climate responsibility.

E N D
Assessment of contributions to climate changeResults of phase II Bracknell 25 September 2002 Niklas Höhne ECOFYS energy & environment
Questions: What is the effect of taking non-linearities into account? Which indicators should be used to describe contributions to climate change?
Simplified cause-effect chainfrom emissions to climate change Emissions N2O ... Emissions CH4 Emissions CO2 Concentrations N2O ... Concentrations CH4 Concentrations CO2 Radiative forcing Temperature change Damages
Effect of peak emissions Global CO2 emissions Concentrations Radiative forcing Temperature increase
Effect of peak emissions Global CO2 emissions Concentrations Radiative forcing Temperature increase
ConclusionsNon-linearities Including non-linearities • Realistic representation of the climate system • Counting ‘late’ emissions substantially less Not including non-linearities • Unrealistic representation of the climate system • Counting all emissions independent of emissions of others - ‘all emissions are equal’
Simplified cause-effect chainfrom emissions to climate change Emissions N2O ... Emissions CH4 Emissions CO2 Concentrations N2O ... Concentrations CH4 Concentrations CO2 Radiative forcing Temperature change Damages
Characteristics of indicators • Certain and simple -> Near top of cause-effect chain • Close to impacts -> Near bottom of cause-effect chain • ‘Backward looking’: Taking into account the path of historical emissions • ‘Backward discounting’: Weighing less what was emitted longer ago • ‘Forward looking’: Accounting for the effects that occur in the years after emission • Comparable for all greenhouse gases
Indicators for historical responsibility Emissions Time Time Concentrations Time Time C E F Radiative forcing A B Time Time
Comparison Backward Backward Forward looking discounting looking Current radiative forcing - - - Current GWP-weighted - - Xemissions Radiative forcing from X X -increased concentrations Cumulative GWP-weighted X - Xemissions Weighted concentrations X X X Temperature increase X X -also discounting most recent emissions
ConclusionsIndicators • Several for historical responsibility for climate change are available • Of those considered only one (weighted concentrations) is ‘backward looking’, ‘backward discounting’ and ‘forward looking’ • Use a simple indicators ????
Current radiative forcing of current emissions Fossil and industrial CO2 All gases
GWP-weighted emissions Fossil and industrial CO2 All gases
Radiative forcing due to increased concentrations Fossil and industrial CO2 All gases
Cumulative GWP-weighted emissions Fossil and industrial CO2 All gases
Weighted concentrations Fossil and industrial CO2 All gases
Temperature increaseBrazilian Proposal Fossil and industrial CO2 All gases