Download
1 / 48
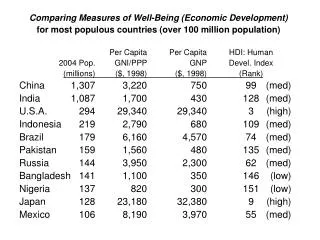
480 likes | 582 Views
The Index of Economic Well-Being - 1984 - 2006. Lars Osberg Department of Economics, Dalhousie University Halifax, Nova Scotia Conference: “Les Indicateurs Locaux de Progrès Sociétal" Rennes, France, November 17, 2006 . .

E N D
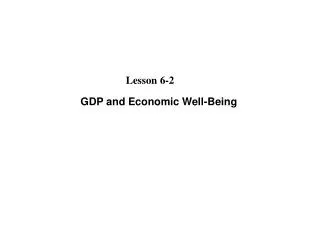
The Index of Economic Well-Being - 1984 - 2006 Lars Osberg Department of Economics, Dalhousie University Halifax, Nova Scotia Conference: “Les Indicateurs Locaux de Progrès Sociétal" Rennes, France, November 17, 2006.
Origin – a seemingly simple question:"Are you better off today than you were four years ago?" 1980 Ronald Reagan 1976-80 actual increase in per capita disposable income in USA = 8.8% Audiences answered “NO!” – WHY ? 1984 - Osberg Paper for MacDonald Commission emphasized: Widespread dissatisfaction with GDP as a measure of Economic Well-Being and: Alternative aggregate measures also sum to a single index, burying value judgments
Components of:Index of Economic Well-Being (IEWB) Stocks of wealth Economic Well-Being Consumption flows Economic equality Economic security
2006: ‘Are “you” better off ?’ • Who is “you” ? • Individual or Citizen ? • Personal well-being – no statistics needed • Statistics on ‘well-being’ are only needed if the issue is social decision-making • “Well-being” as “citizen” requires information on collectivity • “Indicateurs Locaux de Progres Societal”
2006: Real Issue in Social Indicators‘Is the community “better off” ?’ • As voters or bureaucrats, individuals make decisions re: collectivity • Voting example: I will vote for policy X if Ix = 1 (own utilityx) + 2 (society’s well-beingx) > other alternatives • Indicators of “Society’s Well-being” • Needed for individual policy & voting decisions • Statistics = feedback loop of public policy • Economic Well-Being - multi-dimensional • Index should respect heterogeneity • Values / Preferences • Life Circumstances
What is the point of Index construction? • Policy choices must be made • With multiple outcomes of differing dimensionality • Affecting many dissimilar individuals • Objective of index construction: • To assist democratic discourse by disentangling • When values differ • When factual judgments differ • To enable individuals to make better summative subjective judgments on social choices
Heterogeneity in Values • ECONOMIC WELL-BEING= 1 CONSUMPTION + 2 SUSTAINABILITY / INTERGENERATIONAL BEQUEST+ 3 INCOME DISTRIBUTION / POVERTY + 4 SECURITY • DIFFERENT VALUES WILL IMPLY DIFFERENT WEIGHTS • Useful to know whether (& how much) perceived trend in aggregate well-being depends on weighting • = 0 is a (strong) value choice • GDP per capita • sets 3 = 4 = 0 • assumes 1 AND 2 optimal always
What is Well-Being ?What is Economic Well-Being? Economic Well-Being < Well-Being Economic Well-Being > GDP Economic output > Marketed $ output GDP omits many sources utility value household labor value of leisure length of life, etc. GDP includes “regrettable expenditures” Costs of pollution, crime, commuting, etc
Human Well-being- includes well-being from much more than economics (e.g. personal freedoms, relationships, spiritual & intellectual discovery)
Economic Well-being < Well-being - but some aspects of well-being depend on tradeoffs in scarce resources – ‘economic’ Economic Well-being
Economic Well-being and GDP marketed $ output < total goods & services GDP GDP Economic Well-being
“Social regrettables” – part of GDP, but not well-being “Social regrettables” - Costs of crime, pollution, commuting GDP GDP Economic Well-being
GDP per capita • GDP rigorously standardized across countries (SNA) – the clear point of comparison • Can one do better? Does it make any difference ? • But - Strong Implicit assumptions when used as measure of economic well-being • aggregate share of income devoted to accumulation (including value of unpriced environmental assets) automatically optimal • poverty, inequality & economic insecurity do not matter • changes in leisure time, length of life, family size, costs of commuting, pollution & crime - all irrelevant • + poor match to popular perceptions of trends in economic well-being
Payoff to per capita GDP growth in self-reported happiness ≈ nil
Average Consumption Flows $ • Marketed real consumption per capita • Adjustments • value of increased longevity of life • reduced economies of scale in household consumption • changes in working hours – leisure • Government services • provision of non-marketed or heavily subsidized services • includes defense and capital consumption allowances • excludes debt service charges and transfer payments
Wealth Stocks, Sustainability and Intergenerational Bequest $ • Physical capital stock from SNA • State of environment and national heritage (degradation -) • cost of CO2 emissions @ $ 85 per tonne • Value of natural resource stocks • price + quantity change • Stocks of human capital • Evaluated at cost of schooling • Research and development capital stock • Net foreign indebtedness (-) • NOTE: Real productive assets only
Income Distribution Index • How to summarize “Distribution”? • Simplicity desirable if index to be used • Poverty & Inequality differ, but both matter • Inequality • Gini coefficient • After-tax & transfer household income • Equivalence scale = • Poverty • Sen-Shorrocks-Thon measure • Rate • Average poverty gap ratio • Intensity = rate x gap • Index = 0.75*Poverty + 0.25*Inequality
Universal Declaration of Human Rights - 1948 • [25] “Everyonehas the right to a standard of living adequate for the health and well being of himself and of his family, including food, clothing, housing and medical care and necessary social services, and the right to security in the event of unemployment, sickness, disability, widowhood, old age or other lack of livelihood in circumstances beyond his control.”
“Economic Security” • Risk of income loss due to unemployment • changes in employment rate x UI coverage x UI replacement rate • Risk of financial loss due to illness • Uninsured medical expenses as % disposable income • Risk of single parent poverty • poverty rate & gap for single women with children • divorce rate of legally married couples • Risk of poverty in old age • chance x depth of elderly poverty
“Economic Security” • Risk of loss due to unemployment • Risk of Unemployment + E(financial loss|unemployment) • Financial Risk of Illness • Unreimbursed private medical expenses as share of disposable income • Risk of single parent poverty • Divorce rate x poverty rate x poverty gap of single parents • Risk of poverty in old age • chance x depth of elderly (>65) poverty • Security risks weighted by relevant population size
Security from Unemployment • Original method – financial loss implied by compound probability =P(U)*P(B|U)*(E(B/W) • Assumes components matter equally • Decline UI/EI coverage has big impact on trends • New literature on self-reported happiness • Di Tella, MacCulloch, Oswald (2003) “The Macro Economics of Happiness” RESTAT • Ordered Probit life satisfaction – n= 271,224 • Recover Implicit weights on Unemployment Rate and Unemployment Benefits • This paper: Unemployment rate = 4x UIBen • = .8*(scaled Unemp) + .2*(scaled P(B|U)*(E(B/W))
Does it matter?How different is trend in IEWB & GDP? • Trend in IEWB depends partly on how heavily current consumption is weighted compared to: • Sustainability / accumulation • Income Distribution • Security • Excel data sheet available for experimentation @ • http://www.csls.ca/iwb.asp
Figure 2a: The Index of Economic Well Being and its Components in the United Kingdom, 1980-2001
Policy Implications ? • Much less gain in economic well-being than in real GDP per capita 1980-2004 • Major reason has been growth in inequality & insecurity • Reducing Inequality & Insecurity was the major objective of the welfare state • BUT de-emphasized in recent years • Social Policy Design should aim at increasing Well-Being
The role of the natural environment Natural Capital EWB GDP
Physical Investment Natural Capital Produced Capital EWB GDP
Human and Social Capabilities Natural Capital Produced capital Human and Social Capabilities GDP EWB
The role of knowledge/skills Natural Capital Produced capital Human and Social Capabilities GDP Human capital EWB
Definitions • Human Capital • “The knowledge, skills, competencies and attributes embodied in individuals which facilitate the creation of personal, social and economic well-being • Social Capital • “Networks together with shared norms, values and understandings which facilitate co-operation within or among groups”
The role of networks/social norms Natural Capital Produced capital Human and Social Capabilities GDP Human capital Social capital EWB
Close ties between human and social capital Natural Capital Produced capital Human and Social Capabilities EWB Human capital Social capital GDP
The role of institutions Natural Capital Produced capital Human and Social Capabilities GDP Human capital Social capital EWB Political, institutional and legal arrangements
Natural Capital Produced capital Human and Social Capabilities GDP Human capital Social capital EWB Political, institutional and legal arrangements
Natural Capital Produced capital Human and Social Capabilities GDP Human capital Social capital EWB Political, institutional and legal arrangements
In both 1984 & 2006 – why do we care if indicator goes ‘up’ ? • Standard Indicators have ambiguous relation to Well-being • GDP per capita excludes leisure, environment & more • Hourly wages ? Employment ? • Not valued directly – but indicate a more fundamental objective • Wage = price of labour; • potential consumption? Market ‘power’? • Unemployment = unused labour; • insecurity? Social exclusion ?
Methodology • Variables now scaled linearly • Consistent with other indices (e.g. HDI) • Solves “Directionality Problem” • (Max – value)/(Max – Min) • OR (Value – Min)/(Max-Min) • Problems: • Reporting trends as % change or % points • Scaling removes base – sensitive to comparison group • “Base Case” assigns equal weight to all dimensions • Excel data sheet available for experimentation • http://www.csls.ca/iwb.asp