Louisiana Office of State Climatology: Research and Data Services Overview
The Louisiana Office of State Climatology at LSU provides essential data services and applied research related to climate and weather events. Annually, it handles hundreds of data and media requests, contributing significantly to programs like the RISA-Southern Climate Impacts Planning Program (SCIPP). Recent research includes analyses of significant storms, such as the May 2010 Nashville storm and rain patterns across Tennessee. The office also maintains SURGEDAT, a comprehensive database mapping storm surge activity along the Gulf Coast, utilizing extensive historical sources.

Louisiana Office of State Climatology: Research and Data Services Overview
E N D
Presentation Transcript
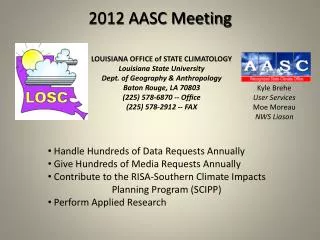
2012 AASC Meeting LOUISIANA OFFICE of STATE CLIMATOLOGYLouisiana State University Dept. of Geography & Anthropology Baton Rouge, LA 70803 (225) 578-6870 -- Office (225) 578-2912 -- FAX Kyle Brehe User Services Moe Moreau NWS Liason • Handle Hundreds of Data Requests Annually • Give Hundreds of Media Requests Annually • Contribute to the RISA-Southern Climate Impacts Planning Program (SCIPP) • Perform Applied Research
THREE EXAMPLES OF RECENT RESEARCH • Nashville, TN Storm of May 1-2, 2010 – w/ AWA • Rainiest TSs and Hurricanes in the Eastern US • SURGEDAT – Storm Surge Database Nashville, TN May 2010 Wilks-Barre, PA June 1972 (H Agnes) Bolivar Peninsula, TX September 2008 (H Ike)
Nashville Storm and Flooding May 1-2, 2010 Deep Trough – W./C. US * Slow Moving Cold Front * Strong Advection off of Gulf Figure 1: Surface and 500-mb maps at 0700 EST (1200 UTC) for 1-3 May 2010 from the Daily Weather Map series provided by National Oceanographic and Atmospheric Administration’s (NOAA) Hydrometeorological Prediction Center.
Geographical Pattern of Rainfall Across Tennessee, May 1-2, 2010 Peak near Brownville at 19.71”
Depth-Area-Duration Table for Point of Maximum Rainfall
Return Frequencies of the Tennessee Storm May 1-2, 2010 Nashville, TN Brownsville, TN
Wettest TSs and Hurricanes in the U.S. 1960-2011 in Water Volume (192 Storms)
Storm Tracks and Rainfall Patterns for Hurricanes Agnes and Ike From: David Roth, Hydrometeorological Prediction Center, NCEP, NOAA
SURGEDAT – The World’s Most Comprehensive Tropical Storm Surge Database
SURGEDAT utilized 70 sources of surge data (U.S. Gulf Coast) Federal Government: 28 Books and Academic Publications: 23 Historic newspapers: 16 titles 3,120 pages of newspaper read
Building Full Envelopes of Storm Surge: Example Hurricane Ike