Download
1 / 11
110 likes | 232 Views
Decadal Water Mass Variations in the Northeast Atlantic Ocean. G C Johnson, J Bullister, M Baringer, C Mordy, C Sabine, J-Z Zhang, R Wanninkhof, & R Feely (NOAA/PMEL, NOAA/AOML, & JISAO) 4 sections at 20 W between 1988 & 2003 reveal:

E N D
Decadal Water Mass Variations in the Northeast Atlantic Ocean G C Johnson, J Bullister, M Baringer, C Mordy, C Sabine, J-Z Zhang, R Wanninkhof, & R Feely (NOAA/PMEL, NOAA/AOML, & JISAO) 4 sections at 20W between 1988 & 2003 reveal: SubPolar Mode Water (SPMW) trends warmer, lighter, & shallower. Marked AOU & PV increases below SPMW. Mediterranean Outflow Water (MOW) spreads northward. Labrador Sea Water (LSW) trends colder, fresher, denser, & deeper. Changes consistent with North Atlantic Oscillation (NAO) shifts. Repeat section analysis requires a spatial and temporal context.
20W Sections: 4 occupationsover 15 years 2003 CO2/CLIVAR Repeat Hydrography NOAA/NSF Funded Bullister & Gruber 1998 CHAOS Smythe-Wright 1993 NOAA OACES Wanninkhof & Doney 1988 WOCE A16N McCartney, Talley, & Tsuchiya
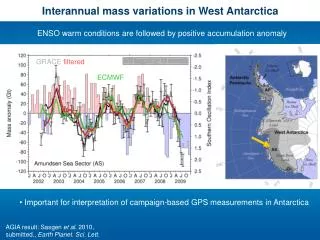
NAO: LSW & SPMW From Stramma et al. (2004) Positive NAO 1980-1995 (bottom panel shading) LSW decreases (top panel line) LSW h increases (bottom panel line) SSH Anomalies along 20W imply upper water changes: 1993 relatively dense (cold) mid-90’s switch (with NAO) 1998 light (warm) 2003 lighter (and warmer) (1988 not measured)
Mean 20W (C) & S (PSS-78) SPMW MOW LSW
Property Changes vs. Mean (40N to Iceland) NCEP/NCAR Anomalies 15-25W, 40-63N SPWM MOW LSW SPWM MOW LSW
Summary 4 sections at 20W between 1988 and 2003 reveal: LSW trends colder, fresher, denser, & deeper. MOW spreads northward 2003 (warmer, saltier, O2-poorer) Oxygen values decrease (AOU increases) just below SPMW (consistent with lighter and shallower ventilation). SPMW generally shifts warmer, lighter, shallower (between 1993 & 1998) These changes are likely related to The NAO shift to positive in early 1980’s & the NAO shift to negative in mid-90’s The literature argues that SPMW & MOW changes are mostly from circulation variations. LSW changes are from ventilation variations. There are large and related carbon variations . . .
Discussion There are large and related carbon variations . . . Quantifying ocean CO2 storage is a central goal Ocean processes (circulation, ventilation) vary interannually Repeat sections are occupied at decadal intervals at basin scale Conflict arises between affordability and aliasing. How to put repeat sections into spatial & temporal context? PV-AOU variability relation: is it global, useful? What about oxygen sensors on Argo floats? Costs: sensors, telecom, energy (float equivalents), & data management. Numerical modeling, data assimilation Are biogeochemical results available/reliable? Should we worry about large perturbations? Riser (UW)