Download
1 / 19
190 likes | 412 Views
Economic News and Stock Market Correlation: A Study of the UK Market. Financial News. Consider this news item about the Karachi Stock Exchange (KSE) in Pakistan:

E N D
Economic News and Stock Market Correlation: A Study of the UK Market
Financial News • Consider this news item about the Karachi Stock Exchange (KSE) in Pakistan: • “The KSE 100 was broadly lower amid fears of escalating tensions with India in the wake of recent massacre in the disputed Kashmir region”. • FACT : The overall value of 100 key stocks traded in the KSE was lower than the previously reported. • FACT: Massacre in Kashmir • FACT: Disputed region of Kashmir • SENTIMENT: Fears of escalating tension
Financial News • Carries MARKET SENTIMENT. • Can be regarded as “information arrival”. • May explain current economic performance or predict the state of the future economy.
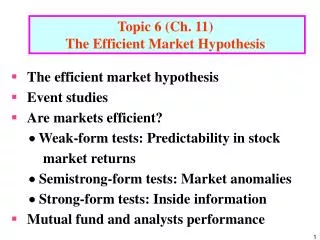
What is an efficient market hypothesis? • Effect of news is rapidly accounted for in the market. • Financial traders react to news events and make investment decisions accordingly. • Example 1: Karachi Stock Exchange (July 15, 2002) – “Broadly lower amid fears of escalating tensions with India in the wake of recent massacre in the disputed Kashmir region”. • Example 2: Karachi Stock Exchange (July 17, 2002) – “Muted response by India to last week's deadly attack in Kashmir inspired keen demand and rises beat falls 5 to 2 ratio”.
What is a time series? • A time series is a set of time ordered data (numeric) entries. Example (KSE 100 around July 17, 2002):
What’s the Upshot? • There is a possible link between financial news and the market index. • There might be some correlation between them. • What is a correlation?
Correlation • Correlation is a statistic that indicates extent of relationship between two series of numbers. • Positive value of the statistic suggests that the two series behave in a similar manner or are correlated ‘correlation’. • Negative value suggests the opposite: ‘anti-correlation’.
Economic News and Stock Market Correlation • FTSE 100 Data is a time series. • Financial News Published in UK needs to be converted to a time series. • HOW?
Converting News to a Time Series? • We count total number of ‘good’ and ‘bad’ words within a news text. • We analyse about 30 news texts per day (weekdays) that are published on www.reuters.co.uk • For each weekday, we generate a ‘good’ word and ‘bad’ word frequency.
Converting News to Time Series • We have identified over 70 terms each for conveying ‘good’ and ‘bad’ news. • Example: • ‘Good’ terms accelerate, gained, strong, etc. • ‘Bad’ terms anaemic, decline, tumbles, etc.
Converting News to Time Series • Example: Frequency of ‘Good’ and ‘Bad’ words in a week in Nov 2001:
Next Step • To display this data (‘good’ and ‘bad’ word frequency) alongside corresponding FTSE 100 data and to determine the correlations
Prototype SATISFI • SATISFI Sentiment and Time Series: Financial analysis system • SATISFI Screenshot for November 2001: FTSE 100 Good
‘Good’ ‘Bad’ FTSE 0.15 -0.31 FTSE Shifted One Day Ahead* -0.08 -0.34 FTSE Shifted Two Days Ahead* -0.48 -0.58 Prototype SATISFI • Correlation Results of SATISFI (November 2001): *Shifting: To see whether news follows the market or vice versa
FTSE Vs ‘Good’ FTSE Vs ‘Bad’ Manual 0.21 -0.67 SATISFI -0.15 -0.25 Discussion and Future Work • In a recent workshop, we analysed a same set of news manually and by SATISFI. • 172 Reuters news stories for 4-8 February 2002 were analysed. • Correlation Results:
Outlook • Important to know the entity involved in the ‘good’ or ‘bad’ evaluation. Example: rising inflation is considered good using this method, however this is bad for stocks. • Negation. Example: not seen rising negates the rise. • To determine the ‘goodness’ or ‘badness’ of particular words. Example: surge or bankruptcy are more powerful than slight rise or declining.
Thank You Questions / Comments ??