Download
1 / 18
180 likes | 315 Views
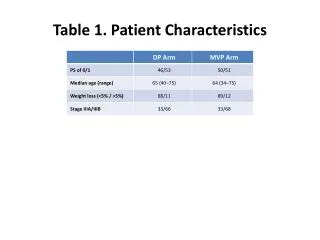
Table I. Continuous Patient Characteristics at Hospital Admission. BSA, body surface area. Table III. Primary Device Implant. Table IV. Intention to Treat. Table VI. Major Causes of Death. Table VII. Risk Factors for Death after Device Implant.

E N D
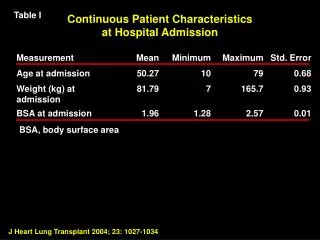
Table I Continuous Patient Characteristics at Hospital Admission BSA, body surface area
Table III Primary Device Implant
Table IV Intention to Treat
Table VI Major Causes of Death
Table VII Risk Factors for Death after Device Implant
ISHLT/MCSD RegistryJanuary 2002 – May 2004, n=413 Table VIII
Table IX Summary of Post-Implantation Patient-related Events
Table X Device Malfunction
Figure 1 (279) (140) (78) (33) ISHLT/MCSD Analysis: Jan 2002 – May 2004 n=413, 105 deaths Months % Survival 1 84 % 3 76 % 6 68 % 12 55 % Deaths / Month Percent Survival Hazard Event: Death after Implant * Months after Device Implant * censored at transplant
Figure 2 ISHLT/MCSD Analysis: Jan 2002 – May 2004 n=413, 105 deaths Primary Device Implant: LVAD only (n=339) PercentSurvival LVAD + RVAD at the same operation (n=74) p < .0001 Event: Death after Implant Months after Device Implant
Figure 3 ISHLT/MCSD Analysis: Jan 2002 – May 2004 n=413 Primary Device Implant: LVAD + RVAD at the same operation Predicted % Mortality at 3 months LVAD (alone) BUN at Implant
Figure 4 (285) (150) (81) (21) ISHLT/MCSD Analysis: Jan 2002 – May 2004 n=413, 18 Explants due to recovery Explant due to recovery / Month Percent freedom from Explant (due to recovery) Event: Device Explant due to Recovery Hazard Months after Device Implant
Figure 5 ISHLT/MCSD Analysis: Jan 2002 – May 2004 n=413, 164 transplants (279) Months % Freedom 1 90 % 3 67 % 6 43 % 12 22 % (140) Transplants / Month Hazard Percent freedom from Transplantation (72) (18) Event: Transplantation Months after Device Implant
Figure 6 ISHLT/MCSD Analysis: Jan 2002 – May 2004 n=413, Death, Transplant, Recovery Instantaneous Event Rates: Transplantation Events / Month Death * Explant due to recovery Months after Device Implant * Censored at transplant
MCSD Study: Jan 2002 – May 2004 Competing Outcomes Analysis (n=339) Primary Implant: LVAD only Figure 7 59 % Proportion of Patients Transplanted Alive (Still waiting) 44 % 30 % Death (before transplant) 26 % 23 % 11 % Explanted (recovery) 3 % 4 % Months after Device Implant
MCSD Study: Jan 2002 – May 2004 Competing Outcomes Analysis (n=74) Primary Implant: LVAD + RVAD at the same operation Figure 8 Alive (Still waiting) Proportion of Patients 48 % Death (before transplant) 43 % Transplanted 33 % 36 % 14 % 13 % 10 % Explanted (recovery) 3 % Months after Device Implant
Figure 9 ISHLT/MCSD Analysis: Jan 2002 – May 2004 n=413 Infection events (n=304) Bleeding events (n=282) Cumulative Events per Patient Thromboembolism (n=59) Months after Device Implant
Figure 10 (285) (132) (70) Device Adverse Events / Month (30) Percent Freedom from Device Malfunction Months % Freedom 1 95 % 3 89 % 6 79 % 12 60 % Hazard Months after Device Implant ISHLT/MCSD Analysis: Jan 2002 – May 2004 n=413