Download
1 / 48
480 likes | 617 Views
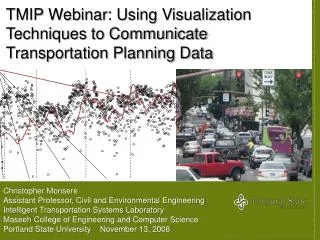
TMIP Webinar: Using Visualization Techniques to Communicate Transportation Planning Data. Christopher Monsere Assistant Professor, Civil and Environmental Engineering Intelligent Transportation Systems Laboratory Maseeh College of Engineering and Computer Science

E N D
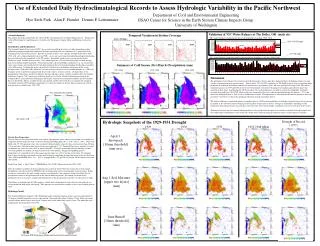
TMIP Webinar: Using Visualization Techniques to Communicate Transportation Planning Data Christopher Monsere Assistant Professor, Civil and Environmental Engineering Intelligent Transportation Systems Laboratory Maseeh College of Engineering and Computer Science Portland State University November 13, 2008
Outline • Our data archive – PORTAL • Data visualization examples • Fuel prices and travel • Green transportation measures • Freeway operations • Transit system performance • Freight system performance • Questions
What’s in the PORTAL Database? Loop Detector Data 20 s count, lane occupancy, speed from 500 detectors (1.2 mi spacing) Incident Data 140,000 since 1999 Bus Data 1 year stop level data 140,000,000 rows Weather Data Every day since 2004 001590 Days Since July 2004 About +700 GB 6.9 Million Detector Intervals VMS Data 19 VMS since 1999 WIM Data 22 stations since 2005 30,026,606 trucks Crash Data All state-reported crashes since 1999 - ~580,000
Performance Measures Used • Volume • Speed • Occupancy • Vehicle Miles Traveled • Vehicle Hours Traveled • Travel Time • Delay
Planning-Operations Connection • Planning for Operations • Regional Concept of Transportation Operations Grant • TSMO & ITS in RTP and TIP • MPO Committees • Congestion Management • Non-recurring • Reliability • System management • Links to freight and demand management
Data Visualization Examples • Fuel prices and travel • Green transportation measures • Freeway operations • Transit system performance • Freight system performance
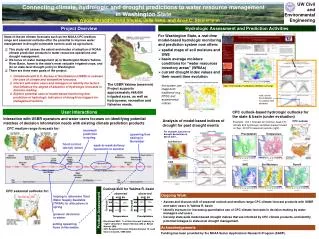
Note: There are many other factors (temperature) and sources (non-mobile) for CO in Portland. This was simply a sample visual comparison, not a correlation analysis.
How Traffic Conditions Are Explained How Traffic Conditions Are Explained What Travelers Actually Experience What Travelers Actually Experience Travel Time Travel Time Annual Average Annual Average Actual Travel Times Vary Day to Day Actual Travel Times Vary Day to Day Segment of Northbound I - 5 in 2005 Jan Jan Feb Feb Mar Mar Apr Apr May May Jun Jun Jul Jul Aug Aug Sep Sep Oct Oct Nov Nov Dec Dec Jan Jan Feb Feb Mar Mar Apr Apr May May Jun Jun Jul Jul Aug Aug Sep Sep Oct Oct Nov Nov Dec Dec 95th Percentile Travel Time 95th Percentile Travel Time Travel Time Travel Time Jan Jan Feb Feb Mar Mar Apr Apr May May Jun Jun Jul Jul Aug Aug Sep Sep Oct Oct Nov Nov Dec Dec How Travelers View Reliability Lyman and Bertini, 2007 What Travelers Remember... What Travelers Remember... Jan Feb Mar Apr May Jun Jul Aug Sep Oct Nov Dec Jan Feb Mar Apr May Jun Jul Aug Sep Oct Nov Dec
Reliability at the Segment Level Lyman and Bertini, 2007
Mapping – Speed By Month July 2005 December 2005 Average Evening Peak Speed (5-6 pm)
Metropolitan Congestion Over Time Winter Spring Summer Fall 2004 2005 2006
Mapping – Speed Subtraction Average Evening Peak Speed (5-6 pm) Difference July-December 2005
Data Quality Reports • Stations Reporting (June 2006 weekdays): • No Traffic (all lanes) > 20% of Samples • Communications Failure > 15% of Samples
Incident Reports Incident on NB I-205, log truck rear-ended a nursery truck, two cars also involved, duration over 4 hours. Incident on SB I-205, NB effects visible
Monthly Incident Reports Incident Types Number of Lanes Affected Incident Locations Number of Ongoing Incidents Number of Incidents Time
Systematically Identifying Bottlenecks Speed (mph)
Systematically Identifying Bottlenecks Speed (mph)
Systematically Identifying Bottlenecks Speed (mph)
Ramp Meter Performance Change in delay (vehicle-hours)
Passenger Boarding Passenger Load
Acknowledgments • R.L. Bertini, Kristin Tufte, M.A. Figliozzi, PORTAL Team • National Science Foundation • Oregon Department of Transportation • Federal Highway Administration • TransPort ITS Coordinating Committee • City of Portland, Office of Transportation • TriMet • Oregon Engineering and Technology Industry Council • PORTAL Team Visit PORTAL Online: http://portal.its.pdx.edu
Thank You! www.its.pdx.edu