Download
1 / 4
40 likes | 132 Views
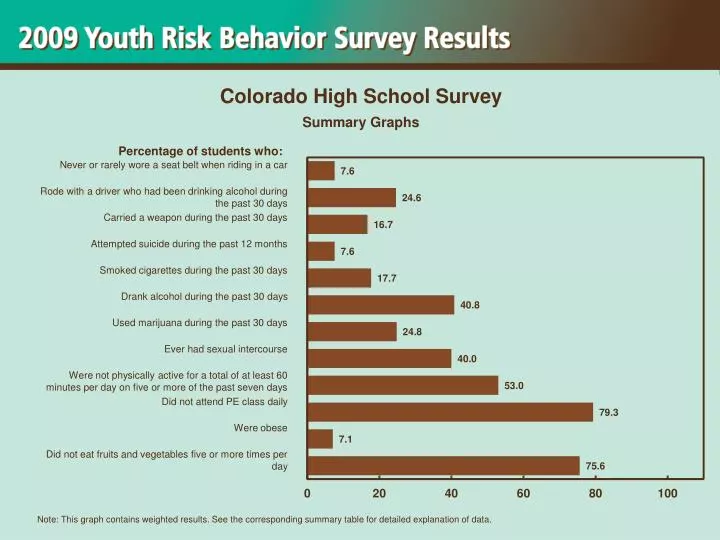
Explore percentages of students engaging in risky behaviors such as not wearing seat belts, alcohol consumption, carrying weapons, and more based on a survey in Colorado high schools. The data is presented in graphical format. Weighted results provided. Refer to the corresponding summary table for detailed insights.

E N D
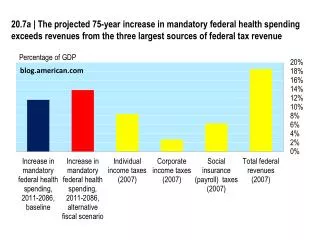
Colorado High School Survey Summary Graphs Percentage of students who: Never or rarely wore a seat belt when riding in a car Rode with a driver who had been drinking alcohol during the past 30 days Carried a weapon during the past 30 days Attempted suicide during the past 12 months Smoked cigarettes during the past 30 days Drank alcohol during the past 30 days Used marijuana during the past 30 days Ever had sexual intercourse Were not physically active for a total of at least 60 minutes per day on five or more of the past seven days Did not attend PE class daily Were obese Did not eat fruits and vegetables five or more times per day Note: This graph contains weighted results. See the corresponding summary table for detailed explanation of data.
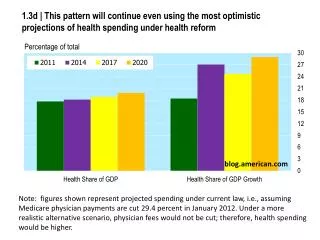
Colorado High School Survey Summary Graphs Percentage of students who: Sometimes, most of the time, or always wore a seat belt when riding in a car Did not ride with a driver who had been drinking alcohol during the past 30 days Did not carry a weapon during the past 30 days Did not attempt suicide during the past 12 months Did not smoke cigarettes during the past 30 days Did not drink alcohol during the past 30 days Did not use marijuana during the past 30 days Never had sexual intercourse Were physically active for a total of at least 60 minutes per day on five or more of the past seven days Attended PE class daily Were not obese Ate fruits and vegetables five or more times per day Note: This graph contains weighted results. See the corresponding summary table for detailed explanation of data.
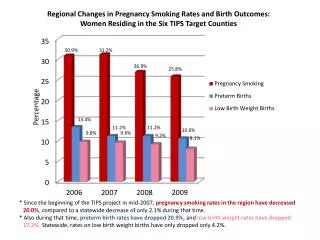
Colorado High School Survey Summary Graphs Number of students in a class of 30 who: Never or rarely wore a seat belt when riding in a car Rode with a driver who had been drinking alcohol during the past 30 days Carried a weapon during the past 30 days Attempted suicide during the past 12 months Smoked cigarettes during the past 30 days Drank alcohol during the past 30 days Used marijuana during the past 30 days Ever had sexual intercourse Were not physically active for a total of at least 60 minutes per day on five or more of the past seven days Did not attend PE class daily Were obese Did not eat fruits and vegetables five or more times per day Note: This graph contains weighted results. See the corresponding summary table for detailed explanation of data.
Colorado High School Survey Summary Graphs Number of students in a class of 30 who: Sometimes, most of the time, or always wore a seat belt when riding in a car Did not ride with a driver who had been drinking alcohol during the past 30 days Did not carry a weapon during the past 30 days Did not attempt suicide during the past 12 months Did not smoke cigarettes during the past 30 days Did not drink alcohol during the past 30 days Did not use marijuana during the past 30 days Never had sexual intercourse Were physically active for a total of at least 60 minutes per day on five or more of the past seven days Attended PE class daily Were not obese Ate fruits and vegetables five or more times per day Note: This graph contains weighted results. See the corresponding summary table for detailed explanation of data.